• <xmp id="om0om">
  • <table id="om0om"><noscript id="om0om"></noscript></table>
  • 自動駕駛

    驗證 NVIDIA DRIVE Sim 攝像頭模型

    在部署自動駕駛車輛之前,需要在各種場景中進行大規模開發和測試。

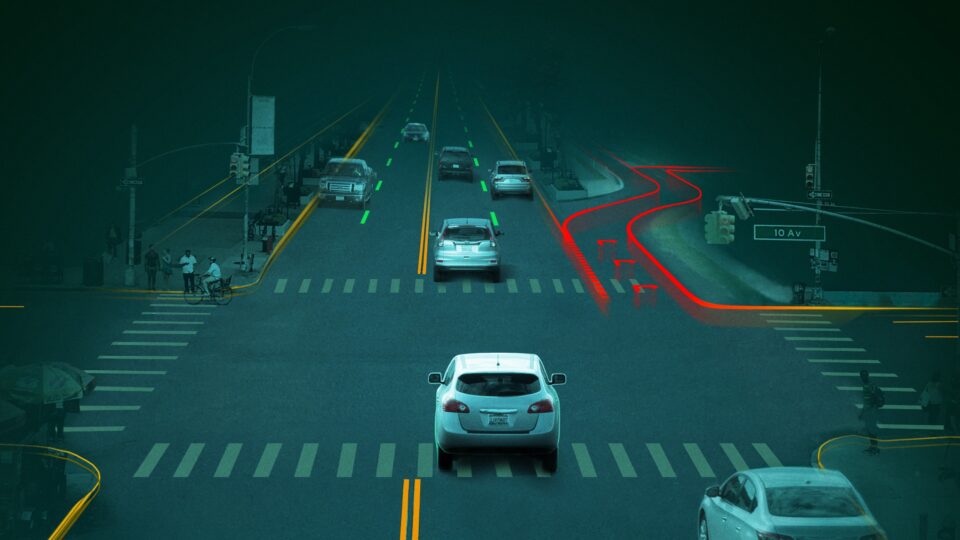
    仿真可以通過為自動駕駛車輛提供可擴展、可重復的環境來應對這些挑戰,以應對訓練、測試和驗證所需的罕見和危險場景。

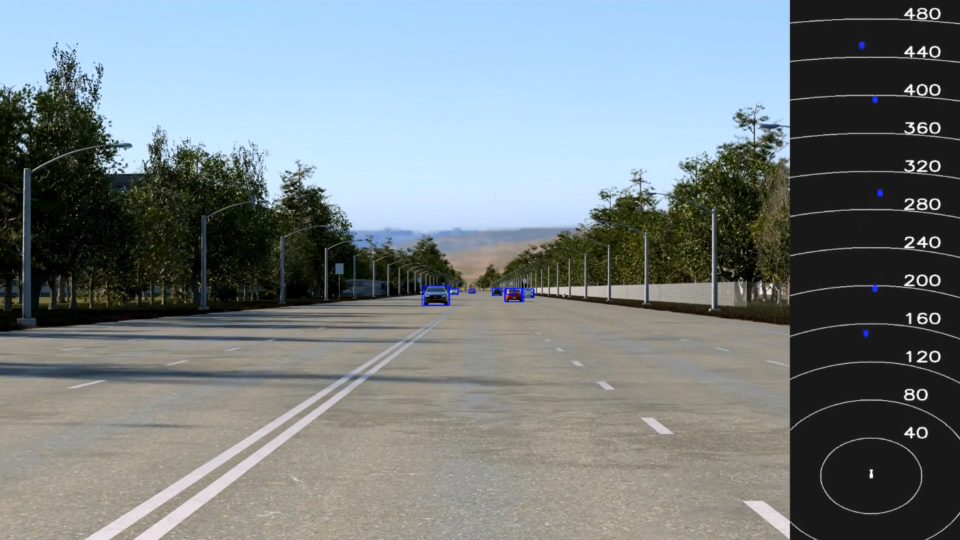
    Omniverse 上的 NVIDIA DRIVE Sim 是專為開發和測試自動駕駛汽車( AV )而構建的仿真平臺。它提供了車輛、 3D 環境和 AV 系統開發和驗證所需傳感器的高保真數字孿生模型。

    與視頻游戲等其他應用程序的虛擬世界不同, DRIVE Sim 必須生成準確模擬真實世界的數據。在工程工具鏈中使用仿真需要清楚地掌握模擬器的性能和局限性。

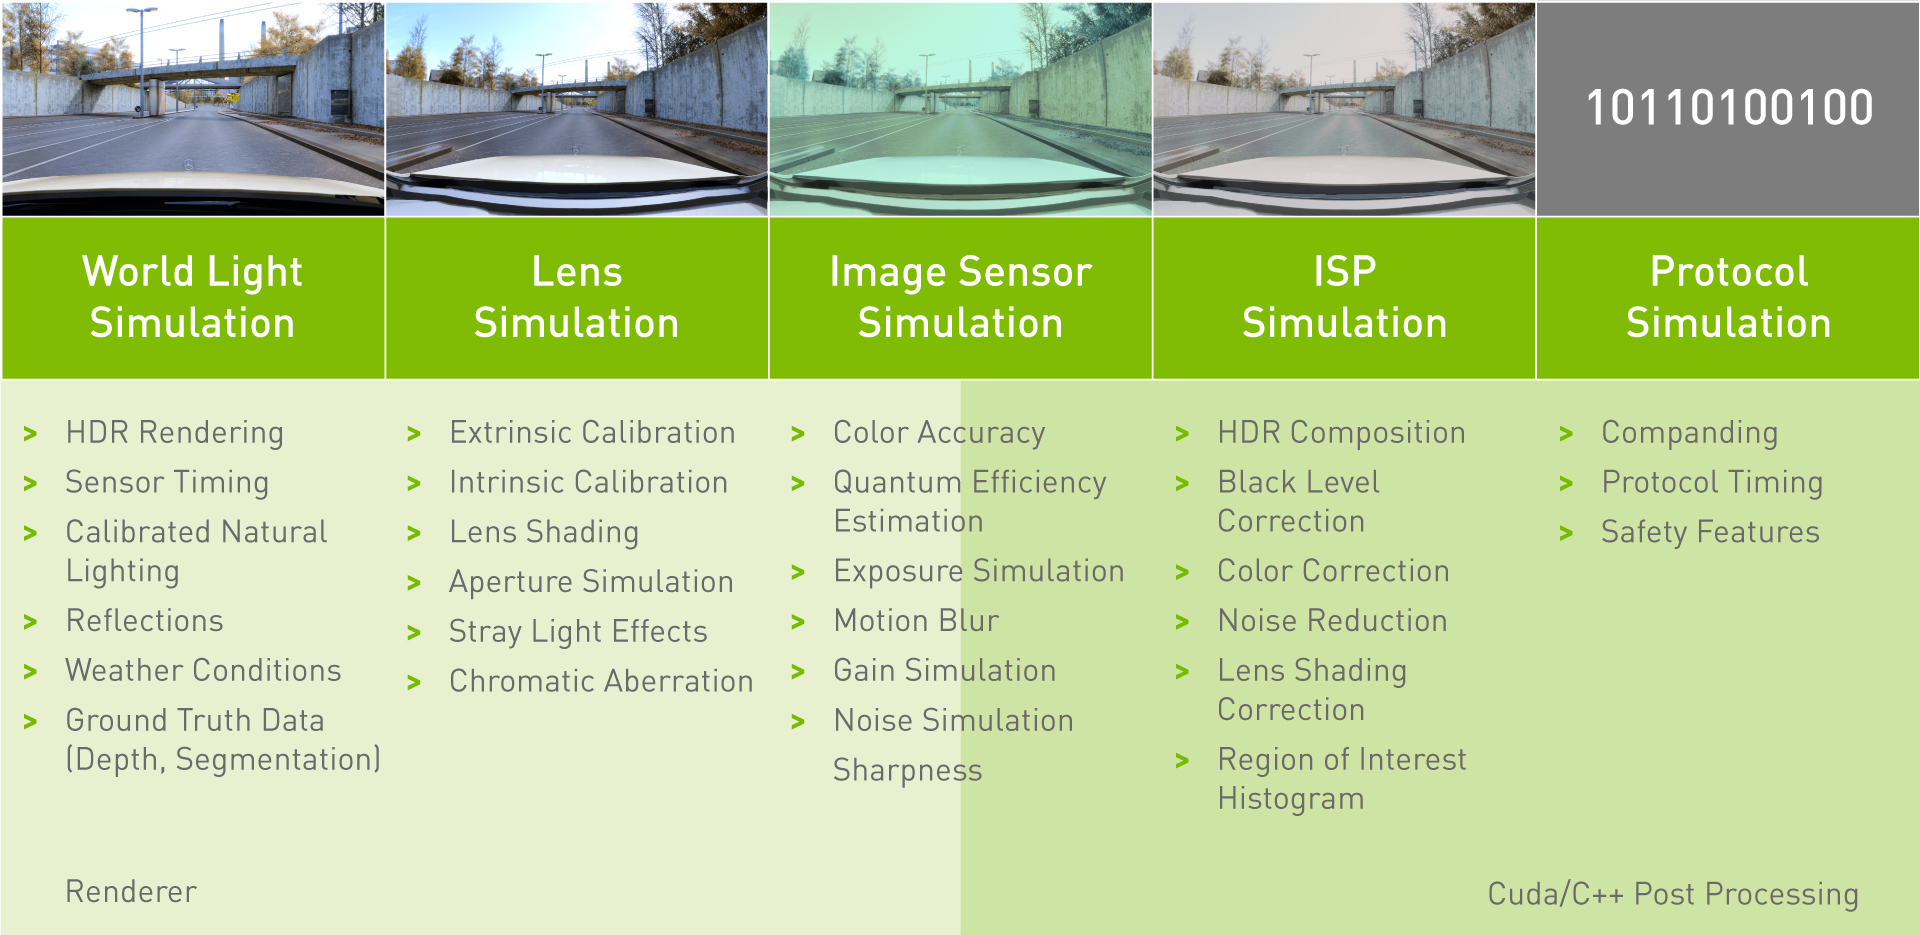
    該精度涵蓋模擬器建模的所有功能,包括車輛動力學、車輛部件、其他駕駛員和行人的行為以及車輛傳感器。這篇文章涵蓋了 DRIVE Sim 中相機模型驗證的一部分,這需要評估每個元素的單獨性能,從世界場景的渲染到協議模擬。

    驗證攝像機仿真模型

    可采用兩種方法對模擬攝像機進行徹底驗證:

    • 對模型每個組成部分的單獨分析(圖 1 )。
    • 一種自上而下的驗證,通過比較在真實或合成圖像上訓練的感知模型的性能,驗證模擬器生成的攝像機數據在實踐中準確地表示真實的攝像機數據。

    單個成分分析是一個復雜的主題。這篇文章描述了我們對相機模型的兩個關鍵屬性的組件級驗證:相機校準(外部和內部參數)和顏色精度。直接與真實世界的相機數據進行比較,以識別模擬圖像和真實世界圖像之間的任何增量。

    A table summarizing the components of an autonomous vehicle camera model, including World Light Simulation, Lens Simulation, Image Sensor Simulation and ISP Simulation.A table summarizing the components of an autonomous vehicle camera model, including World Light Simulation, Lens Simulation, Image Sensor Simulation and ISP Simulation.
    圖 1 。相機模型組件概述

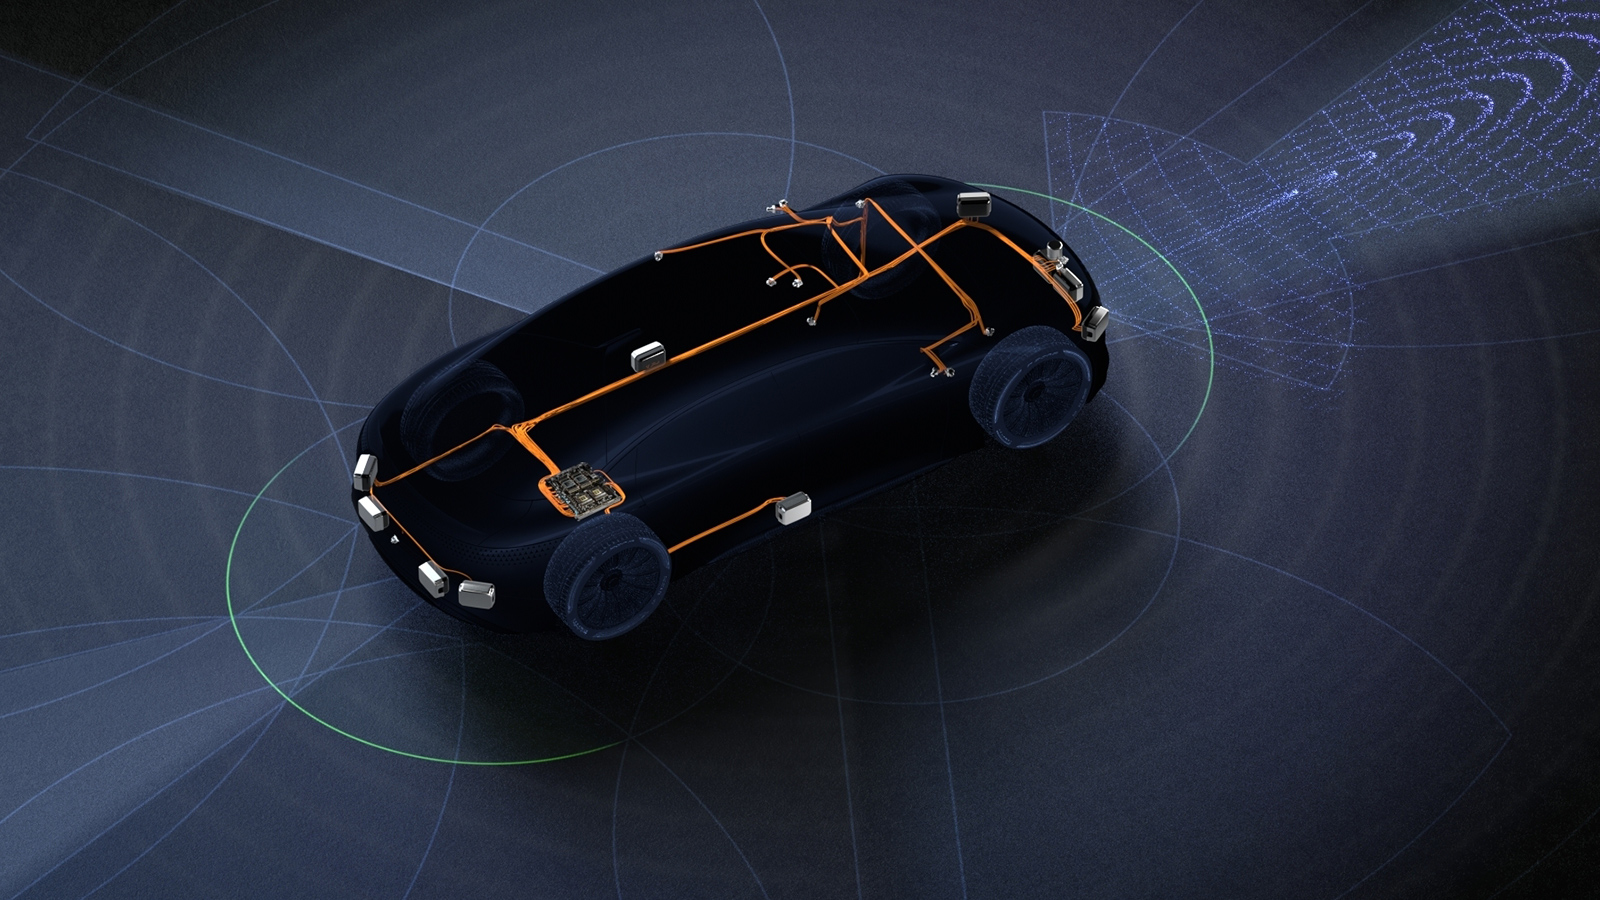
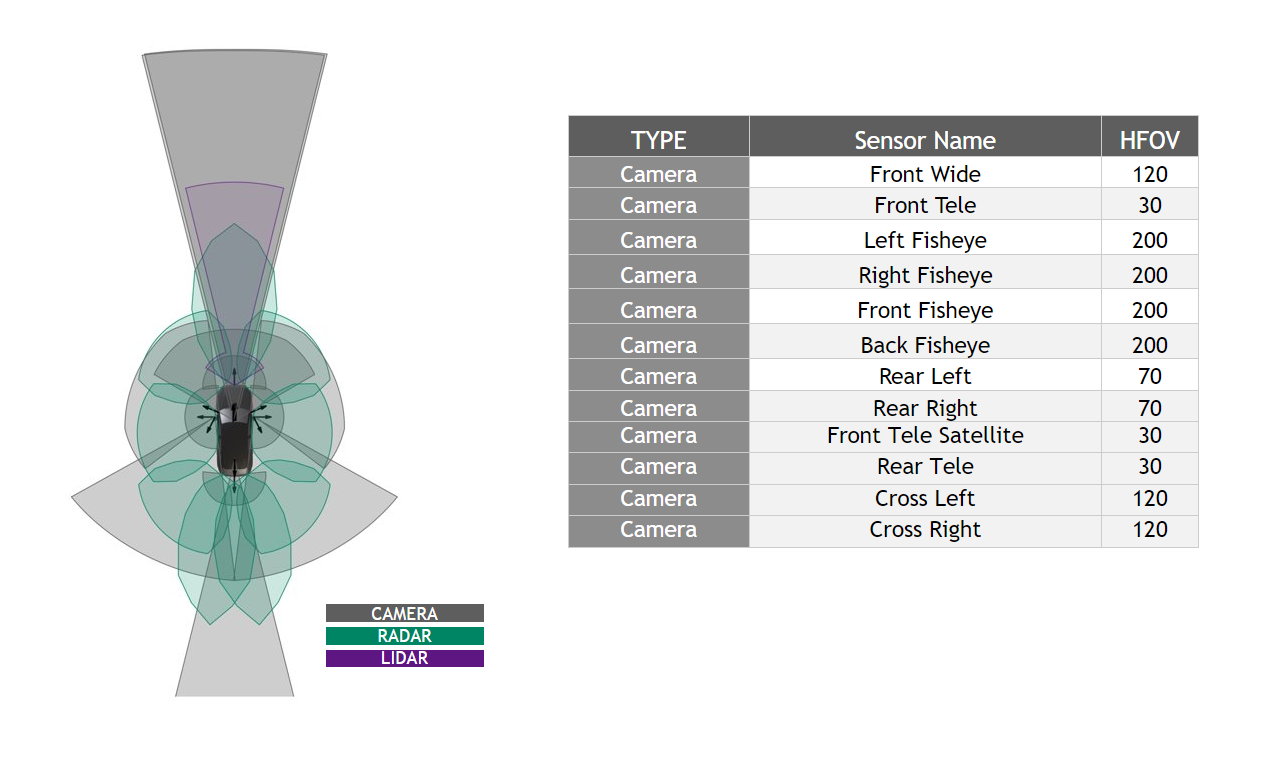
    為了進行驗證,我們選擇使用 NVIDIA DRIVE Hyperion 傳感器套件中的一組相機型號。圖 2 詳細說明了整個測試過程中使用的攝像機模型。

    A breakdown of the NVIDIA DRIVE Hyperion 8 camera sensor set, which includes Front Wide, Front Tele, Left Fisheye, Right Fisheye, Front Fisheye, Back Fisheye, Rear Left, Rear Right, Front Tele Satellite, Rear Tele, Cross Left and Cross right.A breakdown of the NVIDIA DRIVE Hyperion 8 camera sensor set, which includes Front Wide, Front Tele, Left Fisheye, Right Fisheye, Front Fisheye, Back Fisheye, Rear Left, Rear Right, Front Tele Satellite, Rear Tele, Cross Left and Cross right.
    圖 2 。 NVIDIA DRIVE Hyperion 8 傳感器組

    攝像機校準

    AV perception 需要精確了解攝像頭在車輛上的位置,以及攝像頭的每個獨特鏡頭幾何如何影響其生成的圖像。 AV 系統通過攝像機校準處理這些參數。

    模擬攝像機傳感器應在同一校準和數字雙環境下準確再現真實攝像機的圖像。同樣,當輸入校準工具時,模擬攝像機圖像應能產生與真實圖像相似的校準參數。

    我們使用我們的傳感器校準接口 NVIDIA DriveWorks 來估計本文中提到的所有攝像機參數。

    可通過以下步驟驗證攝像機特性:

    • Extrinsic validation :攝像頭外部特性是描述其在車輛上的位置和方向的攝像頭傳感器的特性。外部驗證的目的是確保模擬器能夠在給定的位置和方向準確地再現真實傳感器的圖像。
    • Calibration validation :通過計算重投影誤差來驗證校準的準確性。在實際校準中,此方法用于量化校準是否有效和成功。我們在此應用此步驟來計算在真實圖像和模擬圖像上重新投影的關鍵檢測特征之間的距離。

    內在驗證

    通過設置多項式系數,內在相機校準比其制造公差更精確地描述單個透鏡的獨特幾何結構。

    	heta=c0+c1r+c2r^2 +c3r^3+c4r^4	heta=c0+c1r+c2r^2 +c3r^3+c4r^4

    • rr是到畸變中心的距離(以像素為單位)
    • c0,c1,c2,c3,c4c0,c1,c2,c3,c4是畸變函數的系數
    • 	heta	heta(θ)是以弧度為單位的結果投影角度

    該多項式的校準使 AV 能夠通過描述鏡頭畸變的影響,從攝像機數據中做出更好的推斷。兩個透鏡模型之間的差異可以通過計算它們之間的最大θ失真來量化。

    Diagram showing the maximum theta distortion.Diagram showing the maximum theta distortion.
    圖 3 。最大θ畸變圖

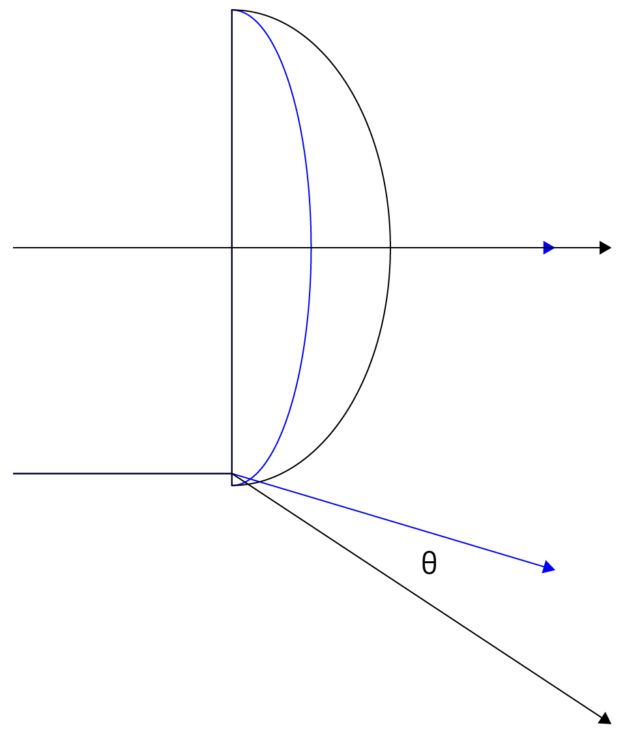
    最大θ失真描述通過透鏡邊緣(對應于圖像邊緣)的光的角度差,其中失真最大。在本測試中,我們使用最大θ失真來描述由真實校準圖像生成的透鏡模型與由合成圖像生成的透鏡模型之間的差異。

    我們根據以下過程驗證了模擬攝像機的固有校準:

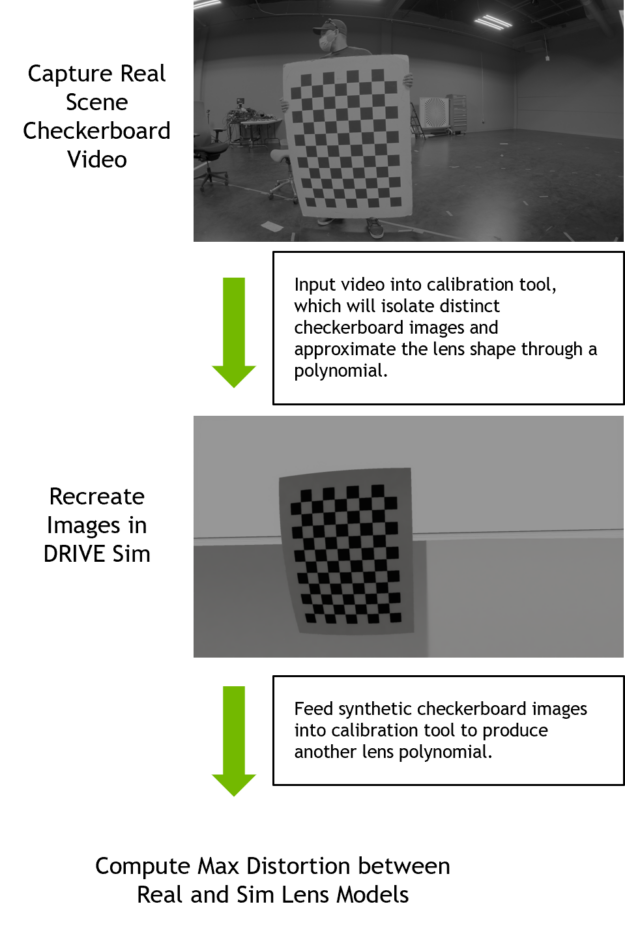
    1. 執行內部攝像機校準: 安裝在車輛或試驗臺上的攝像頭可捕獲棋盤格圖表的視頻,該棋盤格圖表以不同的距離和傾斜度在每個攝像頭的視野中移動。該視頻被輸入到 DriveWorks Intrinsics 約束工具中,該工具將從視頻中提取不同的棋盤圖像,并輸出校準中每個攝像機的多項式系數。
    2. 生成模擬棋盤格校準圖像: 實際攝像頭鏡頭校準數據用于在 Drive Sim 中重新創建每個攝像頭。我們根據校準工具輸出的估計圖表位置和方向,在模擬中重新創建了真實的棋盤圖像。
    3. 從合成圖像生成內部校準: 我們將合成圖像輸入 DriveWorks 校準工具,以生成新的多項式系數。
    4. 計算從真實鏡頭到模擬鏡頭的最大θ失真: 對于每個鏡頭,我們比較了真實圖像校準定義的幾何體與模擬圖像校準定義的幾何體。然后我們找到了兩個透鏡之間光線通過角度變化最大的點。該變化以該透鏡理論視場的(	heta	heta/(FOV*100))報告。
    Flow of steps for intrinsic validation which starts with capturing real scene checkerboard video, then inputting video into calibration tool, then recreating images in DRIVE Sim, then feeding synthetic checkerboard images into calibration tool, and finally computing max distortion between real and sim lens models.Flow of steps for intrinsic validation which starts with capturing real scene checkerboard video, then inputting video into calibration tool, then recreating images in DRIVE Sim, then feeding synthetic checkerboard images into calibration tool, and finally computing max distortion between real and sim lens models.
    圖 4 。內在驗證過程

    每個攝像機的最大θ失真是通過比較其真實 f- θ鏡頭校準與模擬圖像產生的校準得出的。

    Chart comparing the maximum theta distortion from the F-theta model, with front camera fisheye showing the highest at just .58% of theoretical field of view and cross right camera at the lowest.Chart comparing the maximum theta distortion from the F-theta model, with front camera fisheye showing the highest at just .58% of theoretical field of view and cross right camera at the lowest.
    圖 5 。 F- θ模型的最大θ失真

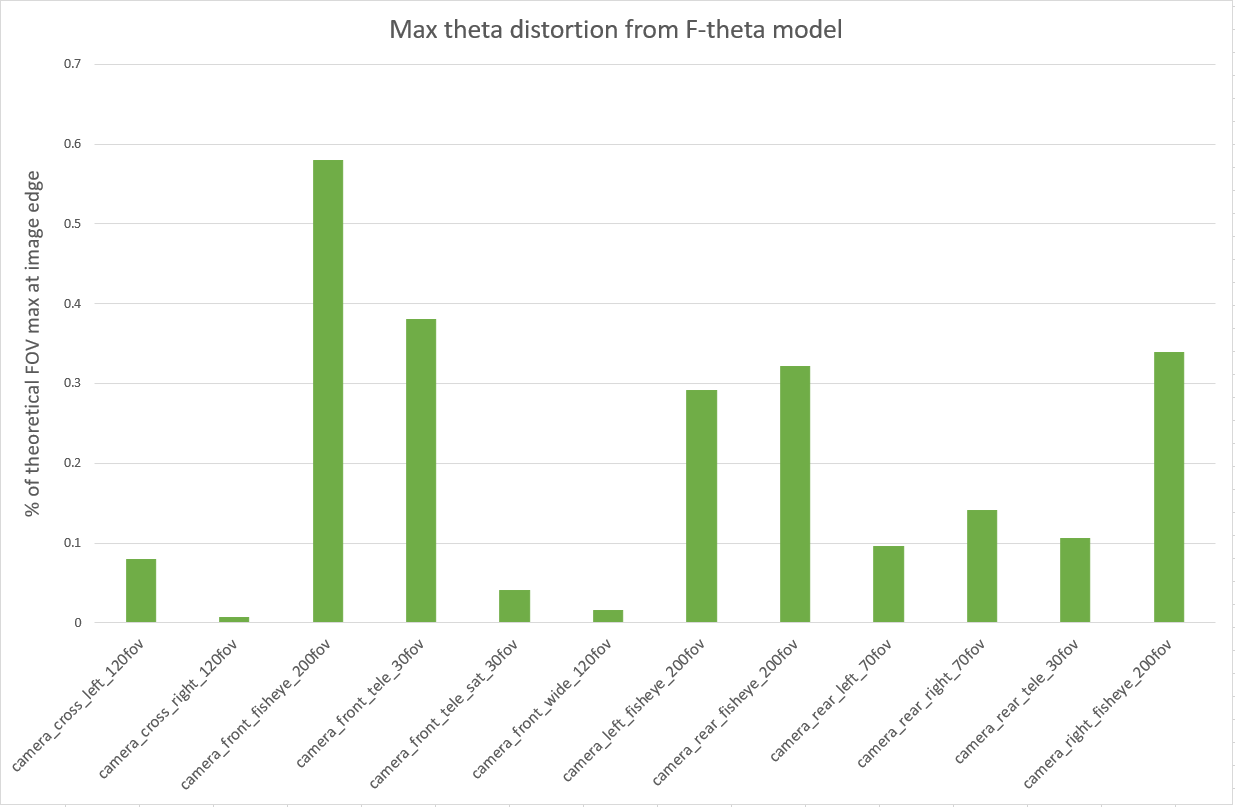
    第一個結果超出了我們的預期,因為模擬的行為是可預測的,并且再現了真實世界校準的觀察結果。

    這一比較為我們的模型準確表示鏡頭畸變效應的能力提供了第一個置信度,因為我們觀察到真實和模擬相機之間存在微小差異。前長焦鏡頭在現實生活中很難約束,因此我們預計它在我們的模擬結果中是一個異常值。

    魚眼攝像頭校準顯示出最大的真實到 sim 差異(前魚眼攝像頭的 FOV 為 0.58% )。

    查看這些結果的另一種方法是考慮畸變對生成圖像的影響。我們在后面的步驟中比較了校準圖中的真實和模擬檢測特征,如 數字特征標記比較 所述。

    我們繼續進行外部驗證方法。

    外部驗證

    我們根據以下過程驗證了模擬攝像機的外部校準:

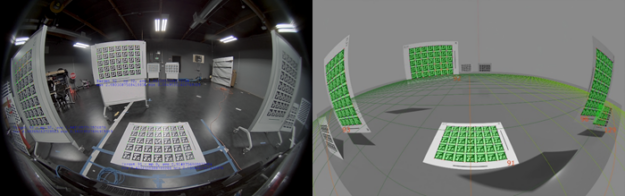
    1. 執行外部攝像機校準 :安裝在車輛或測試臺上的攝像機拍攝到整個實驗室中的多個校準模式( APLILAT TAG )的圖像。我們的測試是,攝像機安裝在NVIDIA DRIVE Hyperion 級 2 +參考架構上。使用 DriveWorks 校準工具,我們計算了攝像機的精確位置和方向以及三維空間中的校準圖表。
    2. 在模擬中重新創建場景: 使用來自真實校準和 AprilTag 海圖位置的地面真相的外部參數,在模擬中以與真實實驗室相同的相對位置和方向生成相機和海圖。系統從每個模擬相機生成合成圖像。
    3. 從合成圖像生成外部校準,并與真實校準進行比較: 合成圖像被輸入到 DriveWorks 校準工具中,以輸出場景中所有攝像機和圖表的位置和方向。我們計算了從真實和合成校準圖像得出的外部參數之間的 3D 差異。
    A diagram of the extrinsic validation process, starting with capturing real scene calibration images, recreating the scene in simulation, capturing the sim scene calibration image, then comparing calculated camera positions, orientations and lens models.A diagram of the extrinsic validation process, starting with capturing real scene calibration images, recreating the scene in simulation, capturing the sim scene calibration image, then comparing calculated camera positions, orientations and lens models.
    圖 6 。外部驗證過程

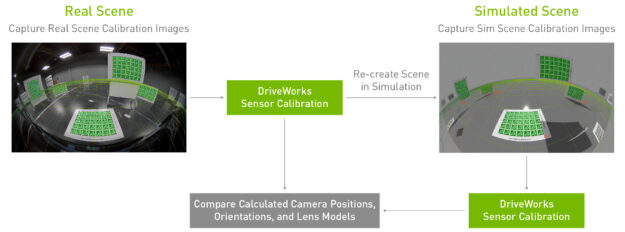
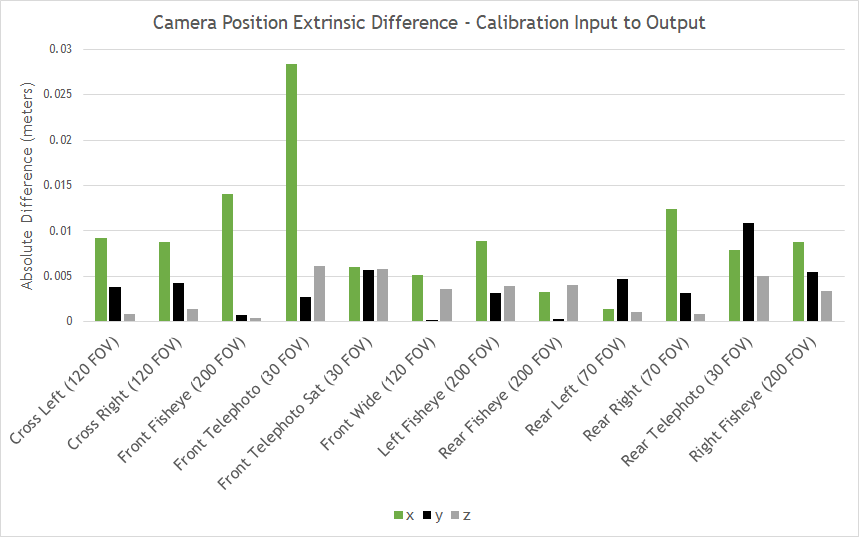
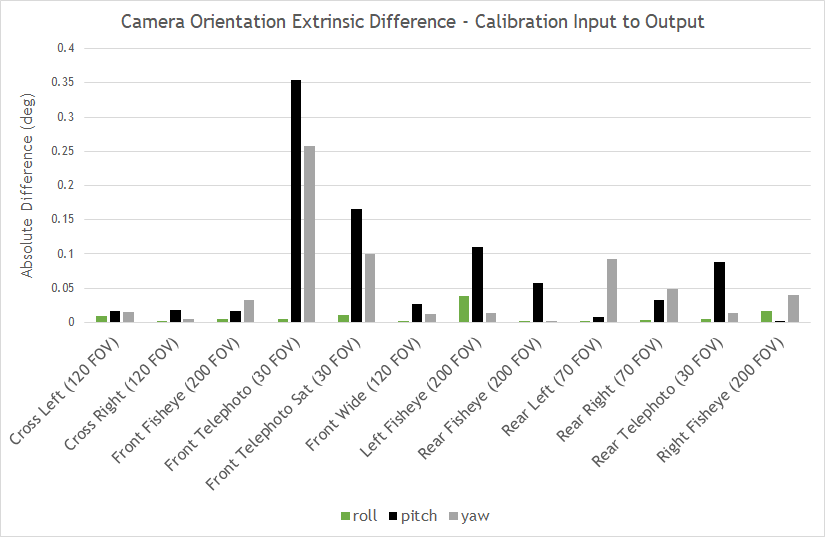
    圖 7 顯示了測試攝影機裝備上 12 個攝影機中每個攝影機的外部參數差異,將真實攝影機校準與模擬攝影機圖像產生的校準進行了比較。所有攝像機位置參數在 3 厘米內匹配,所有攝像機方向參數在 0.4 度內匹配。

    所有位置和方向均以右手參考坐標系為基準,原點位于投射到地平面上的汽車后軸中心,其中 x 與汽車方向對齊, y 向左, z 向上。偏航、俯仰和橫搖是圍繞 z 、 y 和 x 的逆時針旋轉。

    Graph comparing the camera position extrinsic differences, calibration input to output, with front telephoto camera showing the highest absolute difference.Graph comparing the camera position extrinsic differences, calibration input to output, with front telephoto camera showing the highest absolute difference.
    圖 7 。攝像機位置外部差異–校準輸入到輸出
    Graph comparing the camera orientation extrinsic differences, from calibration input to output.Graph comparing the camera orientation extrinsic differences, from calibration input to output.
    圖 8 。攝像機方向外部差異–校準輸入到輸出

    后果

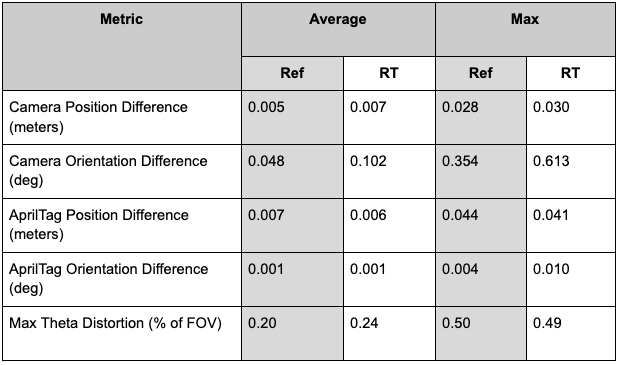
    前面描述的驗證將真實實驗室校準與 DRIVE Sim RTX 渲染器中的 digital twins 校準進行比較。 RTX 渲染器是一種路徑跟蹤渲染器,它提供兩種渲染模式,一種是實時模式,另一種是參考模式(非實時,注重準確性),以根據具體的使用情況提供完全的靈活性。

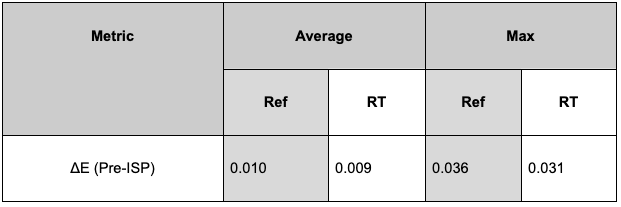
    這個完整的驗證過程是使用 RTX 實時模式和參考模式渲染的數字雙胞胎來完成的,以評估分配給渲染的處理能力降低的效果。請參見下表中的實時驗證結果摘要,以及可供比較的參考結果。

    正如預期的那樣,由于圖像質量降低,在實時渲染時,大多數測量的 real-to-sim 誤差略有增加。盡管如此,基于實時圖像的校準與實驗室校準相匹配,相機的校準范圍為 0.030 米和 0.041 度, AprilTag 位置的校準范圍為 0.041 米和 0.010 度,鏡頭模型的校準范圍為理論視野的 0.49% 。

    Table comparing reference to real-time validation results.
Metric
Camera Position Difference (meters)
Average
Ref
0.005
RT
0.007
Max
Ref
0.028
RT
0.030
Metric
Camera Orientation Difference (deg)
Average
Ref
0.048
RT
0.102
Max
Ref
0.354
RT
0.613
Metric
AprilTag Position Difference (meters)
Average
Ref
0.007
RT
0.006
Max
Ref
0.044
RT
0.041
Metric
AprilTag Orientation Difference (deg)
Average
Ref
0.001
RT
0.001
Max
Ref
0.004
RT
0.010
Metric
Max Theta Distortion (% of FOV)
Average
Ref
0.20
RT
0.24
Max
Ref
0.50
RT
0.49 Table comparing reference to real-time validation results.
Metric
Camera Position Difference (meters)
Average
Ref
0.005
RT
0.007
Max
Ref
0.028
RT
0.030
Metric
Camera Orientation Difference (deg)
Average
Ref
0.048
RT
0.102
Max
Ref
0.354
RT
0.613
Metric
AprilTag Position Difference (meters)
Average
Ref
0.007
RT
0.006
Max
Ref
0.044
RT
0.041
Metric
AprilTag Orientation Difference (deg)
Average
Ref
0.001
RT
0.001
Max
Ref
0.004
RT
0.010
Metric
Max Theta Distortion (% of FOV)
Average
Ref
0.20
RT
0.24
Max
Ref
0.50
RT
0.49
    圖 9 。參考與實時驗證結果

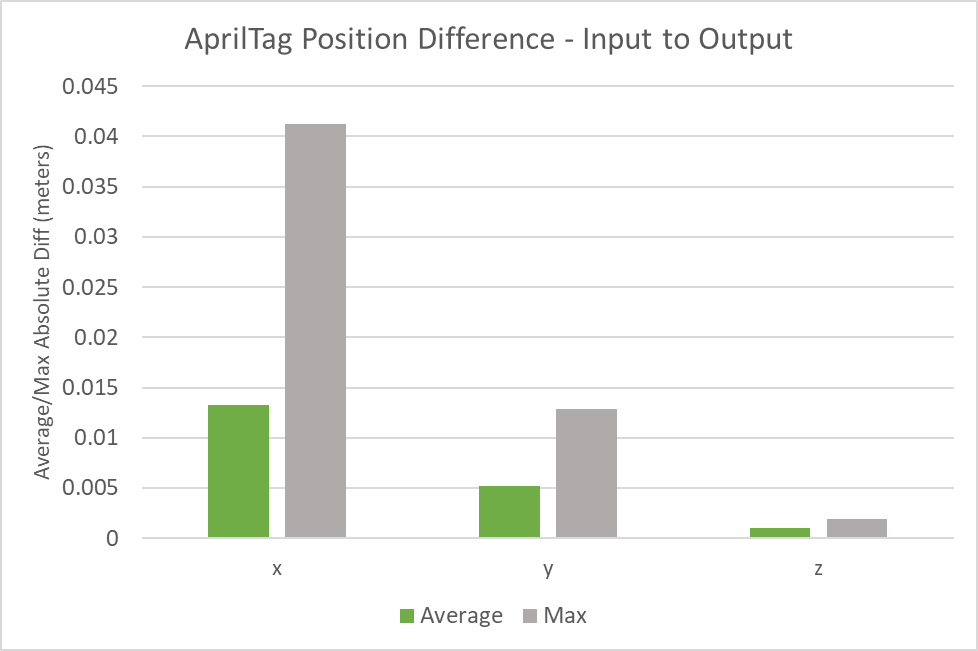
    下圖顯示了真實和模擬環境中 22 個 AprilTag 圖表的平均和最大位置或方向差異。從真實圖表到他們的數字雙胞胎的平均位置差異在所有軸上都小于 1.5 厘米,并且沒有個別圖表的位置差異在任何軸上超過 4.5 厘米。

    所有軸上真實圖表與其數字孿生圖形之間的平均方向差均小于 0.001 度,且任何軸上單個圖表的方向差均不超過 0.004 度。

    Graph comparing the average and maximum AprilTag orientation differences, with X seeing the highest absolute difference for both average and maximum positions.Graph comparing the average and maximum AprilTag orientation differences, with X seeing the highest absolute difference for both average and maximum positions.
    圖 10 。平均/最大 AprilTag 方向差異–校準輸入到輸出

    目前還沒有定義可接受誤差的標準,在該誤差下,可以認為傳感器仿真模型是可行的。因此,我們將我們的位置和方向增量值與真實校準產生的校準誤差進行比較,以確定我們模擬的最大可接受誤差的有效標準。我們測試產生的誤差始終小于在真實世界中觀察到的校準誤差。

    該校準方法基于我們的校準工具使用的統計優化技術,因此會引入自身的不確定度。然而,還需要注意的是, DriveWorks 校準系統在傳感器校準的研究和開發中一直使用,具有較高的精確度。

    這些結果還表明,校準工具可以與模擬渲染圖像一起工作,并提供與真實世界相當的結果。事實上,真實世界的校準系統和我們的模擬是一致的,這是我們的相機模擬模型的第一個重要信心指標。

    此外,該方法還驗證了模擬器作為一個整體,因為用于校準的 digital twin 使用所有 12 個攝像頭對整個場景進行建模,而無需調整值以改善結果。

    為了進一步評估該方法的有效性,我們在真實圖像和模擬圖像之間進行了直接的數字特征標記比較。

    數字特征標記比較

    校準工具提供一個視覺驗證器,根據估計的內在參數將校準圖表位置重新投影到輸入圖像上。圖像顯示了模擬和真實攝像機的檢測特征疊加和重投影統計(平均、標準、最小和最大重投影誤差)示例。

    Image showing the overlay target positions onto input images.Image showing the overlay target positions onto input images.
    圖 11 。將目標位置覆蓋到攝像機\后部\魚眼\ 200fov 的輸入圖像上

    計算重投影誤差使我們能夠進一步斷言先前校準方法的有效性。這種方法解析校準工具檢測到的特征,并將其與真實圖像中的特征進行比較。

    這里,我們將校準圖中每個 AprilTags 的角點視為特征標記。我們計算了在真實圖像上檢測到的特征標記與合成圖像之間的像素距離,用于路徑跟蹤和實時模擬。

    下圖顯示了模擬參考路徑標記和真實特征標記之間 1.4 像素的平均距離。基于實時模擬數據集的相同比較產生 1.62 像素的平均重投影誤差。

    Graph comparing the average reprojection error of each camera model, with camera front telephoto sat, camera front telephoto 30 and camera rear telephoto 30 showing the highest average distance between feature markers.Graph comparing the average reprojection error of each camera model, with camera front telephoto sat, camera front telephoto 30 and camera rear telephoto 30 showing the highest average distance between feature markers.
    圖 12 。平均重投影誤差(參考與實時)

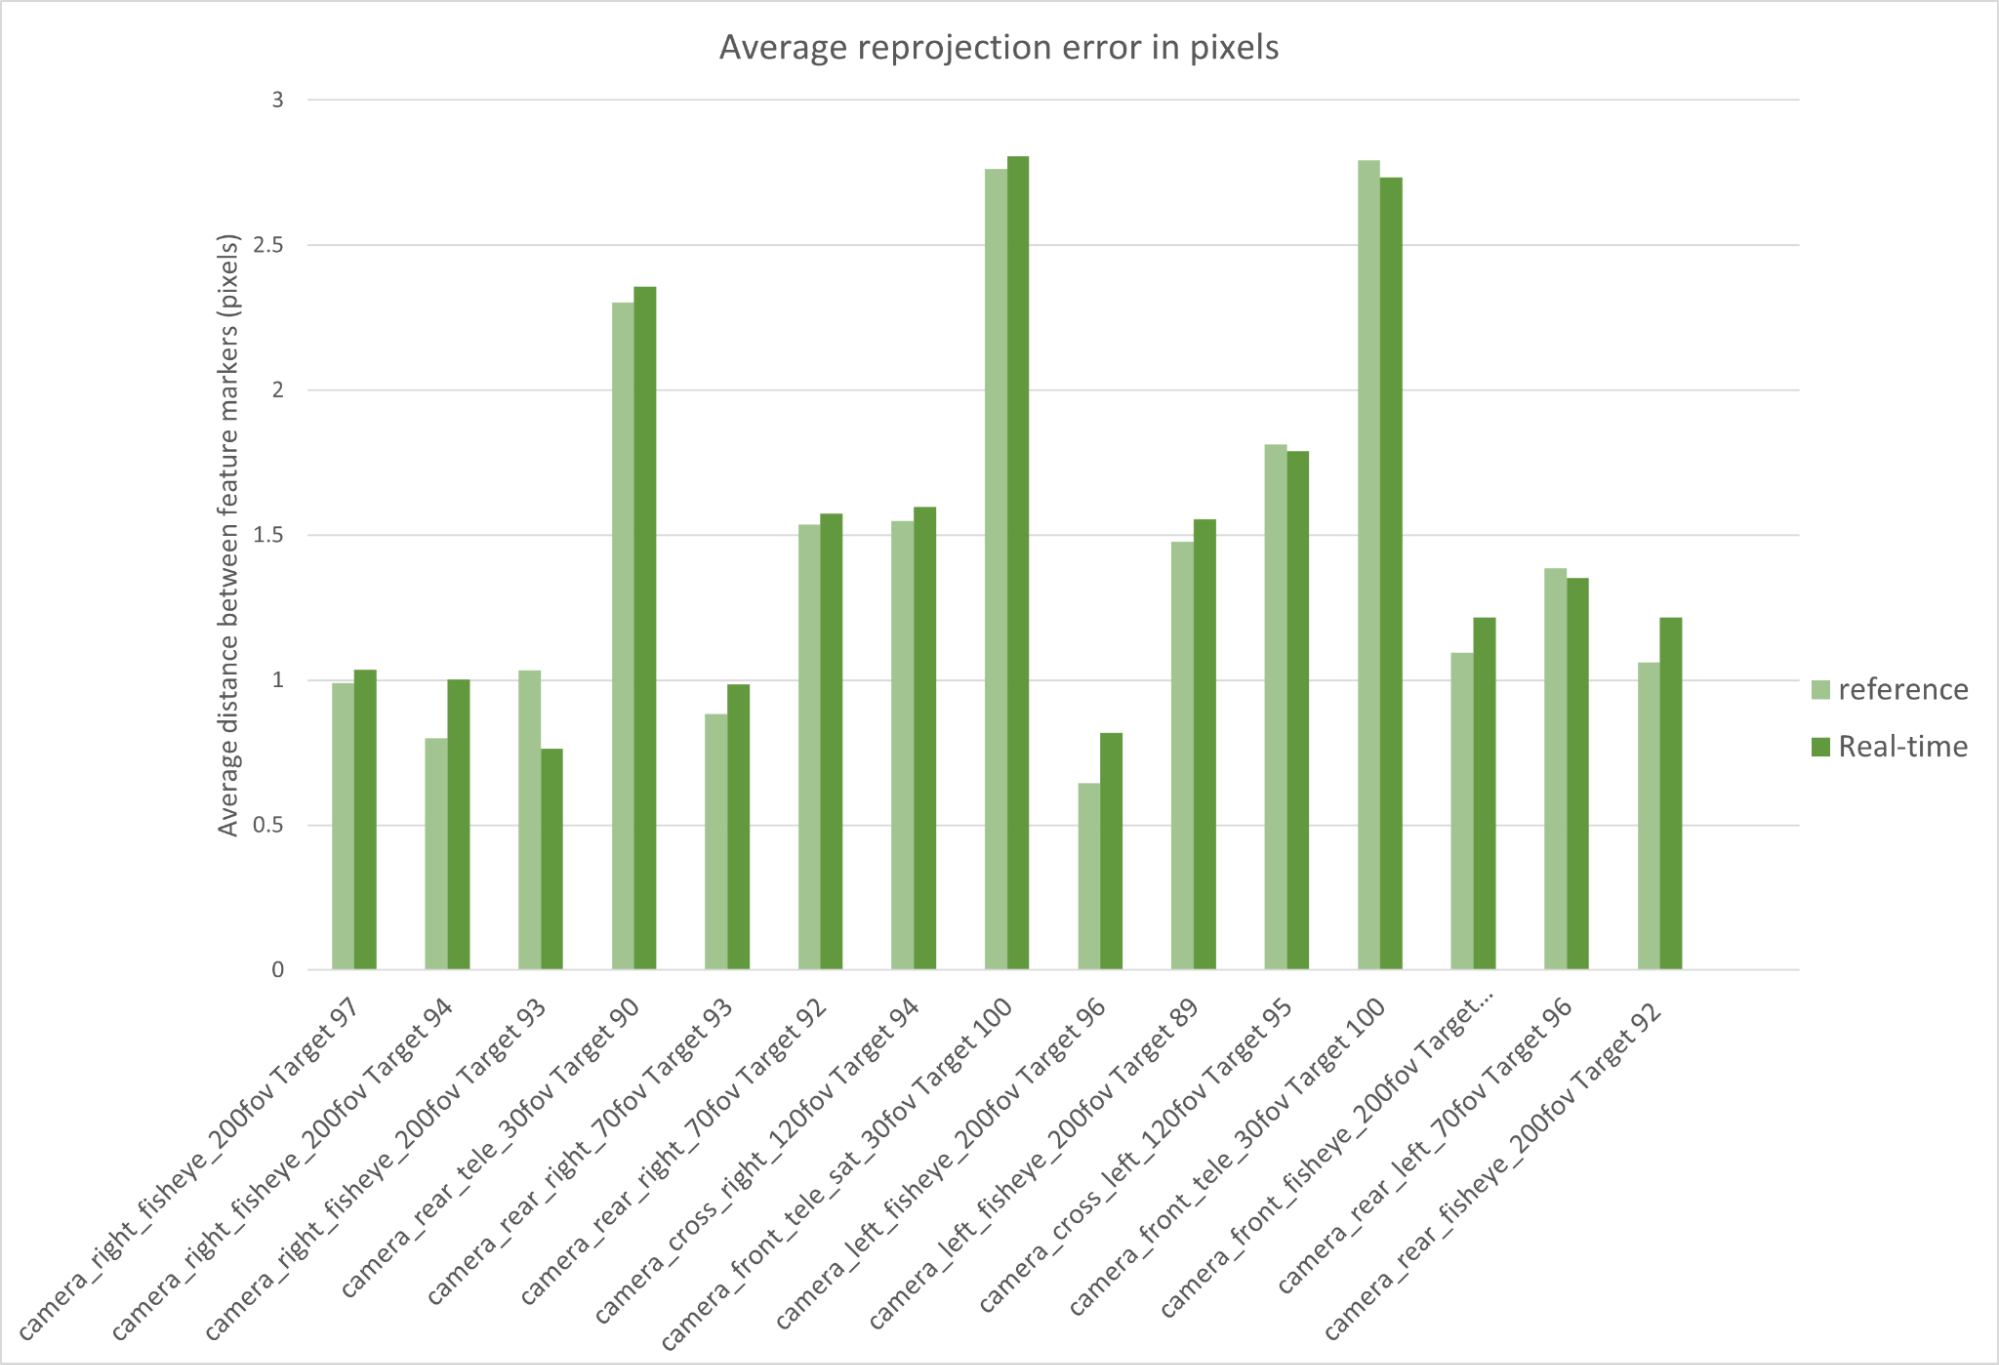
    這兩個值都是實際投影誤差閾值( 2 像素),用于評估實際校準的精度。結果是非常有希望的,特別是因為這種方法不太依賴于我們的校準工具的內部工作。

    事實上,校準工具僅用于估計每個圖像中檢測到的特征標記。標記的比較是基于對三維空間中對象的純算法分析來完成的。

    顏色準確度評估

    攝像機標定結果表明,我們的攝像機傳感器模型生成的圖像與其真實圖像對應的像素對應。下一步是驗證與每個像素關聯的值是否準確。

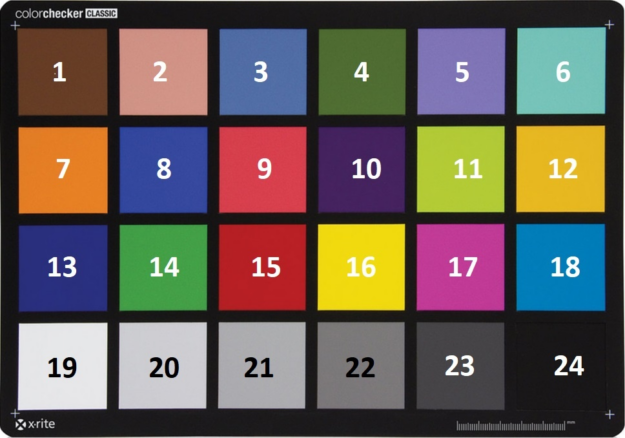
    我們模擬了一個麥克白顏色檢測器圖表,并在 DRIVE Sim 中捕獲了它的圖像,以驗證圖像質量。然后將每個色塊的 RGB 值與相應真實圖像的 RGB 值進行比較。

    除了真實的圖像,我們還介紹了 Iray renderer , NVIDIA 最真實的物理光模擬器,經 CIE 171:2006 驗證。我們首先使用 Iray 渲染系統生成的模擬圖像,然后使用 NVIDIA RTX 渲染器執行此測試。與 Iray 的比較很好地衡量了 RTX 渲染器相對于公認行業黃金標準的能力。

    Sketch depicting the image quality test setup.Sketch depicting the image quality test setup.
    圖 13 。圖像質量測試設置

    我們根據以下過程驗證了模擬攝像機的圖像質量:

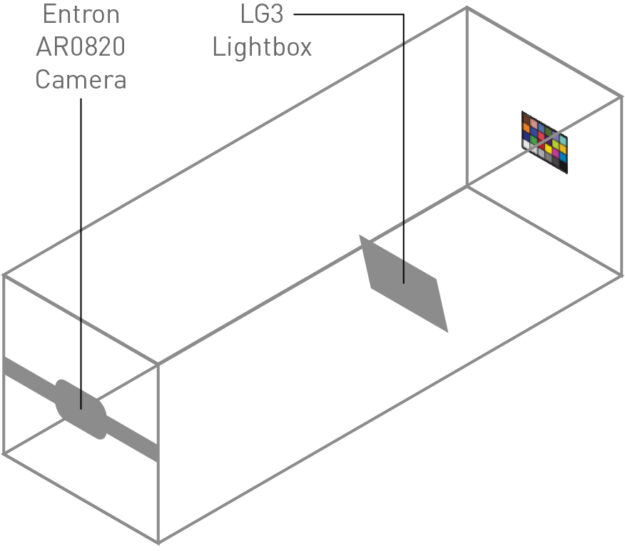
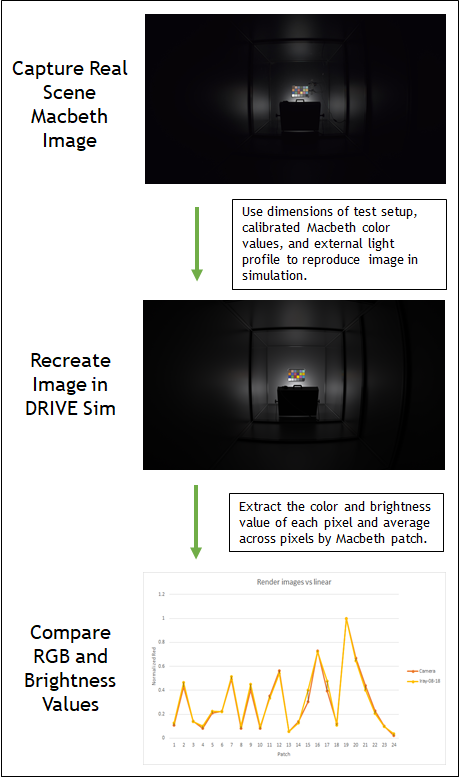
    1. 在試驗箱中捕獲麥克白顏色檢查器圖表的圖像: 將麥克白顏色檢查器圖表放置在測量高度處,并使用特征化的外部光源進行照明。攝像機放置在麥克白圖表已知的高度和距離處。
    2. 在模擬中重新創建圖像: 使用測試設置的尺寸、校準的麥克白圖表值和外部照明配置文件,我們使用 DRIVE Sim RTX 渲染器渲染測試場景。然后,我們使用預定義的相機模型重新創建在實驗室捕獲的圖像。
    3. 提取每個面片的平均亮度和 RGB 值: 我們對所有三幅圖像( real 、 Iray 、 DRIVE-Sim RTX 渲染器)的每個面片中所有像素的顏色值取平均值。
    4. 比較白平衡亮度和 RGB 值: 將每個貼片的測量值與貼片 19 進行標準化,以實現白平衡。我們比較了真實圖像、 Iray 渲染和 RTX 渲染中的平衡顏色和亮度值。
    A diagram of the MacBeth ColorChecker test process, starting with capturing the real scene macbeth image, then calibrating macbeth color values and external light profile to reproduce image in simulation, then extracting color and brightness value of each pixel and average across pixels by macbeth patch, and finally, comparing RGB and brightness values.A diagram of the MacBeth ColorChecker test process, starting with capturing the real scene macbeth image, then calibrating macbeth color values and external light profile to reproduce image in simulation, then extracting color and brightness value of each pixel and average across pixels by macbeth patch, and finally, comparing RGB and brightness values.
    圖 14 。麥克白顏色檢測器測試過程
    An image of the Macbeth ColorChecker reference chart.An image of the Macbeth ColorChecker reference chart.
    圖 15 。麥克白顏色檢測器參考圖
    Chart comparing real and rendered luma and RGB for render-RTX, camera and render lray, with the largest difference observed at 19.Chart comparing real and rendered luma and RGB for render-RTX, camera and render lray, with the largest difference observed at 19.
    圖 16 。真實和渲染 luma 和 RGB 比較
    Chart comparing red color contributions of rendered images to real images for render-RTX, camera and render lray, with the largest difference observed at 19..Chart comparing red color contributions of rendered images to real images for render-RTX, camera and render lray, with the largest difference observed at 19..
    圖 17 。紅色貢獻、渲染圖像與真實圖像的比較
    Chart comparing green color contributions of rendered images to real images for render-RTX, camera and render lray, with the largest difference observed at 19..Chart comparing green color contributions of rendered images to real images for render-RTX, camera and render lray, with the largest difference observed at 19..
    圖 18 。綠色貢獻、渲染圖像與真實圖像的比較
    Chart comparing blue color contributions of rendered images to real images for render-RTX, camera and render lray, with the largest difference observed at 19..Chart comparing blue color contributions of rendered images to real images for render-RTX, camera and render lray, with the largest difference observed at 19..
    圖 19 。藍色貢獻、渲染圖像與真實圖像的比較

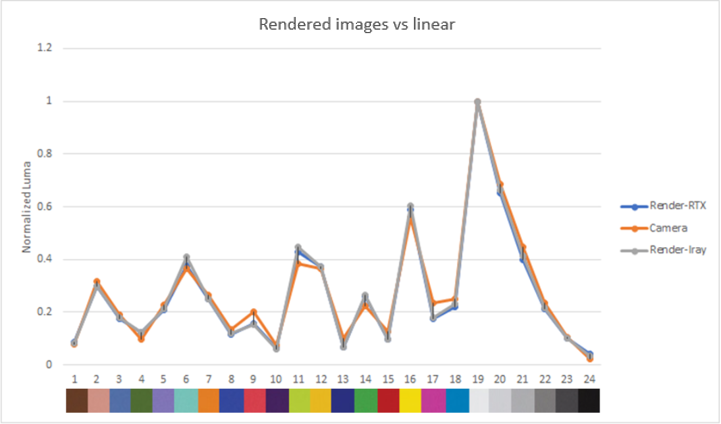
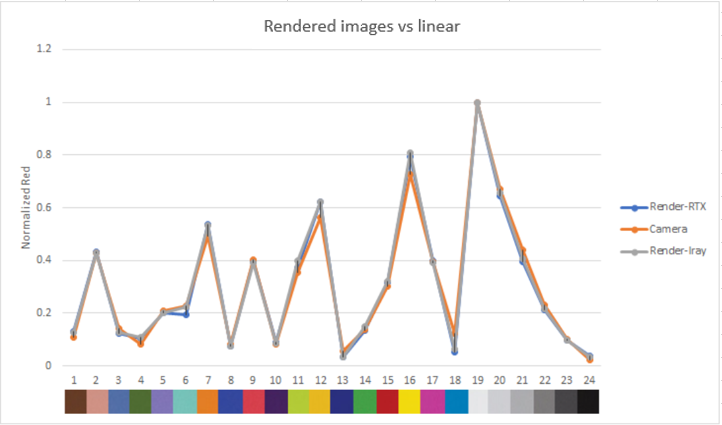
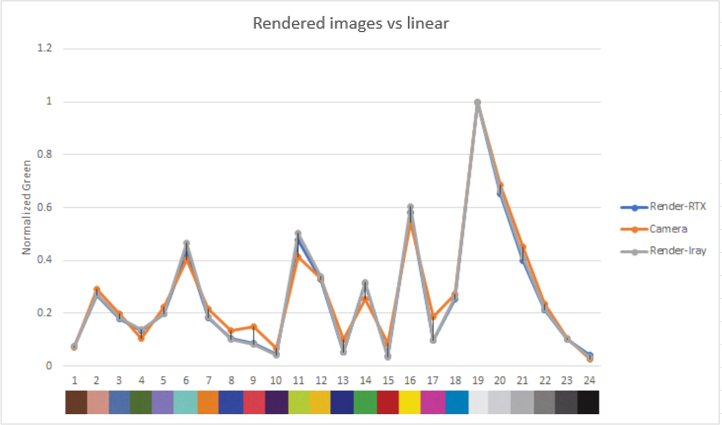
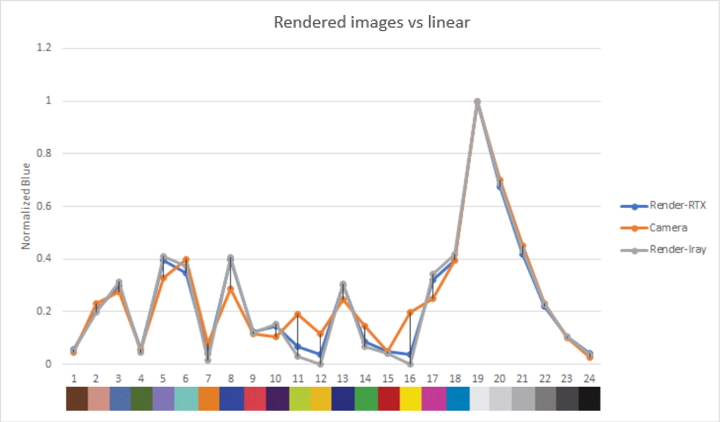
    這些圖顯示了渲染圖像和真實圖像中每個色塊的歸一化 luma 和 RGB 輸出。

    渲染圖像的亮度和 RGB 值都接近真實相機,這使我們對傳感器模型準確再現顏色和亮度貢獻的能力充滿信心。

    為了進行直接的視覺比較,我們展示了麥克白圖表真實圖像和合成圖像的縫合白平衡 RGB 值( Iray 、實時和路徑跟蹤貢獻)。

    圖 20 。縫合 RGB 補丁麥克白顏色圖表(合成與真實)

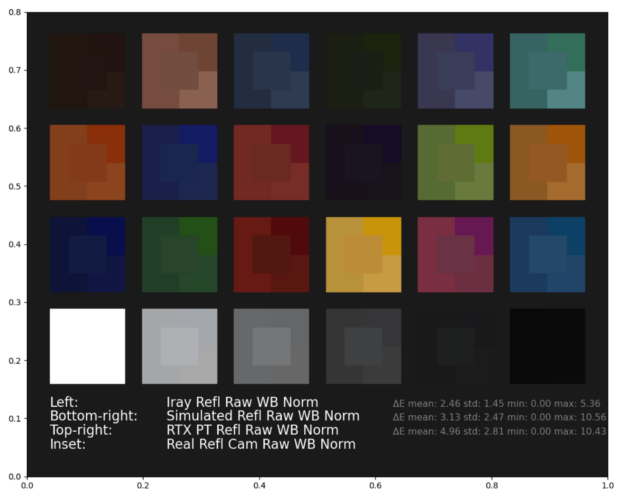
    我們還計算了Δ E (參見圖 22 中的結果),這是一種 CIE2000 計算機視覺度量,它量化了渲染和原始攝影機值之間的距離,通常用于攝影機特征化。Δ E 值越低表示顏色精度越高,人眼無法檢測到低于 1 的值。

    Table comparing CIE2000 sensor reference to real-time results.
Metric
Delta E (Pre-ISP)
Average
Ref
0.010
RT
0.009
Max
Ref
0.036
RT
0.031 Table comparing CIE2000 sensor reference to real-time results.
Metric
Delta E (Pre-ISP)
Average
Ref
0.010
RT
0.009
Max
Ref
0.036
RT
0.031
    圖 21 。 CIE2000 的參考與實時結果

    雖然Δ E 提供了感知色差的良好測量,并被公認為成像標準,但它僅限于人類感知。此類指標對神經網絡的影響仍有待于在進一步的測試中評估。

    結論

    這篇文章介紹了NVIDIA 驗證方法和初步結果為我們的 DRIVE SIM 相機傳感器模型。

    • 我們的結論是,我們的模型能夠準確地再現真實攝像機的標定參數,總體誤差低于真實標定誤差。
    • 我們還參考行業標準的麥克白顏色檢測器對我們模型的顏色精度進行了量化,發現它與典型的研發誤差幅度密切相關。
    • 此外,我們得出結論, RTX 實時渲染是實現這一精度水平的可行工具。

    這證實了 DRIVE Sim 攝像機模型可以在模擬環境中再現真實世界攝像機的上述參數,至少與真實世界中的雙攝像機設置一樣精確。更重要的是,這些測試為用戶提供了信心,即攝像機模型的輸出,如本質、外生和顏色再現,將是準確的,并且可以作為其他驗證工作的基礎。

    接下來的步驟將是在真實世界的 perception 用例中驗證我們的模型,并提供關于在開環中為模型成像 KPI 的進一步結果。

    ?
    0

    標簽

    人人超碰97caoporen国产