Nsight Visual Studio Edition 2019.1 New Features

Next-Gen CUDA Debugger with PTX+SASS source code correlation showing the state at a kernel breakpoint
NVIDIA? Nsight? Visual Studio Edition 2019.1 is now available with these features and improvements:
Graphics Debugging
Added support for
- the latest Turing GPUs for the GPU Frame Debugger, Performance Dashboard, and Range Profiler
-
Win10 RS5, including support for
- the latest DirectX Ray Tracing interfaces in the Frame Debugging and GPU Trace Activities
- ID3D12Device2
-
OpenGL and Vulkan Interoperability debugging
- Enables the Frame Debugging activity for applications using OpenGL and Vulkan simultaneously
- Support EXT_external_objects
- Increased Vulkan extension support
- Added support for 15 Vulkan extensions
-
DirectX11 & DirectX12 NVAPI Metacommands
- Enables analysis of DirectX12 titles utilizing DLSS (Deep Learning Super Sampling)
-
SMP Assist API (NVAPI) For VR Titles
- Supports VRWorks SDK
-
Vulkan Meshlets (VK_NV_mesh_shader)
- Supported in Frame Debugging, Frame Profiling, and C++ Capture Activities
- Increased NVAPI support
- MultiDrawIndirect NVAPI support has been added for DX11
- VRS (Variable Rate Shading) extension support added for DX11
New Features
-
Range Profiler Range Profiler selection linking
- Range Profiler selection now sets the current event to the last event in the selected range
- Enhances transition between profiling and debugging workflows
-
Acceleration Structure / Bounding Volume Hierarchy Viewer
- Supports both DirectX Ray Tracing?and?NVIDIA's?Vulkan Ray Tracing Extension?
-
Vulkan Pixel History
- Inspect pixel/fragment values that impacted the final composition of a pixel within a render target
- Available in the Frame Profiling and Frame Debugging activities
Improvements
- Better UI performance in Frame Debugging and Frame Profiling activities
- Includes several other bug fixes and application compatibility fixes
- Full support for DirectX Ray Tracing C++ Capture serialization
- Numerous UI/UX improvements to the GPU Trace User Interface
- Fixed a bug that would cause GPU Trace to keep the GPU locked to base frequency after Nsight Graphics had been exited when profiling local targets
- Includes several other bug fixes and application compatibility fixes
- Trouble shooting section expanded in User Documentation including Actionable steps are offered to troubleshoot common issues
- Vulkan Capture overhead reduced by up to 15% for some applications
- Includes several bug fixes and application compatibility fixes
Compute Debugging and Analysis
- Added support for
- CUDA Toolkit 10.1
- The latest Turing GPUs
- Win10 RS5
- Nsight Compute Profiler
- Child Process data collection and run comparison now available
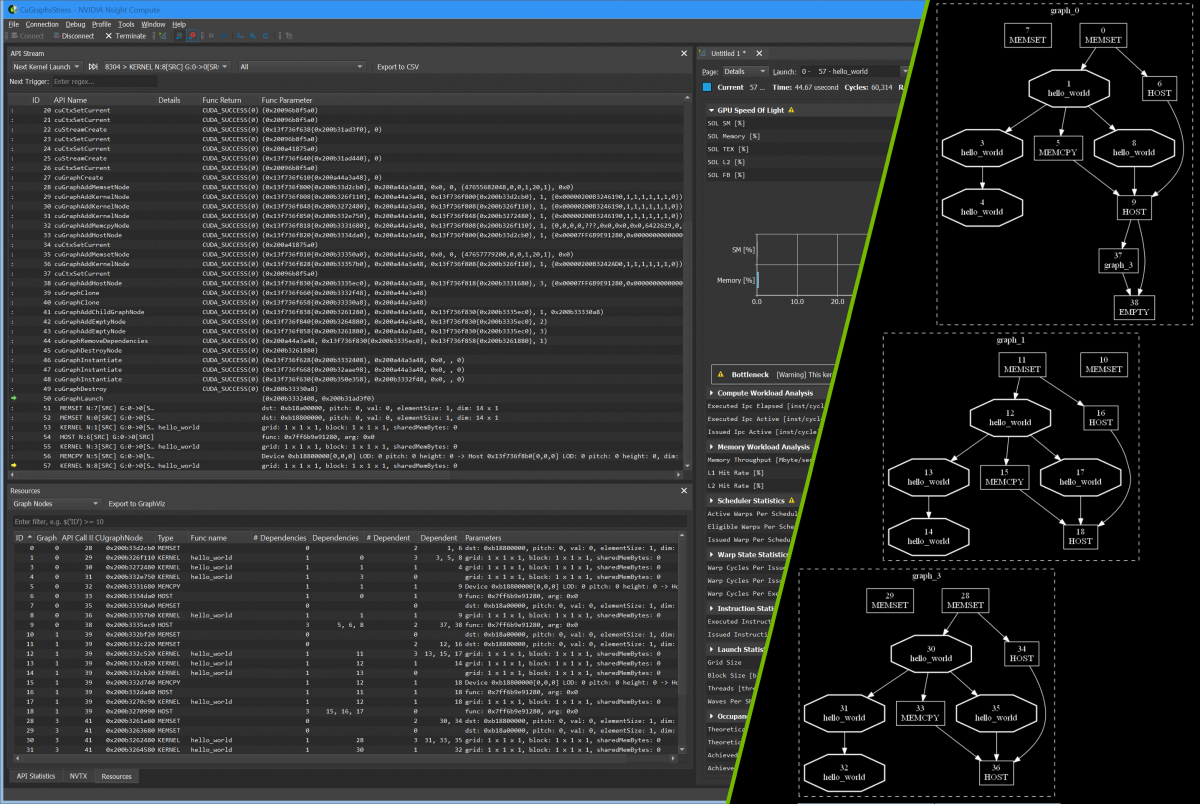
- CUDA Toolkit 10.1 Task Graph support
- CUDA Toolkit 10.1 D3D11 & D3D12 interoperability support
- NVTX support
- Improved reports
- Profiling on Volta GPUs now uses the same metric names as on Turing GPUs
- Details page shows rule result icons in the section headers
- New Section file descriptions are shown in the details page
- Source page supports collapsing multiple source files or functions to show aggregated results
- Source page heatmap color scale improved
- Invalid metric results are highlighted in the profiler report
- New NVTX report page and NVTX context in Details page (when report genereated from CLI with --nvtx)
- Improved CLI
- Support for profiling child processes
- Uses a temporary file if no output file is specified
- New --quiet option
- New --clock-control option for setting the GPU clock control mode
- New --nvtx control to enable NVTX context output for Details and NVTX report pages
- Support for filtering kernel launches for profiling based on their NVTX context using new --nvtx-include and --nvtx-exclude options
- Added new --summary options for aggregating profiling results
- Added option --open-in-ui to open reports collected with NVIDIA Nsight Compute CLI directly in NVIDIA Nsight Compute
- Improved parity with nvprof
- Improved performance
- Improved profiler settings support
- Compatible with NVDIA Nsight Compute 2019.1 reports
For a complete overview of all Nsight? Visual Studio Edition features and access to resources, please visit the main Nsight? Visual Studio Edition page.
NVIDIA? Nsight? Visual Studio Edition 2019.1 is available for download under the NVIDIA Registered Developer Program.

