Most CUDA developers are familiar with the API and its counterparts for loading a module containing device code into a CUDA context. In most cases, you want to load identical device code on all devices. This requires loading device code into each CUDA context explicitly. Moreover, libraries and frameworks that do not control context creation and destruction must keep track of them to explicitly��
]]>
This post was originally published on the RAPIDS AI blog. RAPIDS is about creating bridges, connections, and clean handoffs between GPU PyData libraries. Interoperability with functionality is our goal. For example, if you��re working with RAPIDS cuDF but need a more linear-algebra oriented function that exists in CuPy, you can leverage the interoperability of the GPU PyData ecosystem to��
]]>
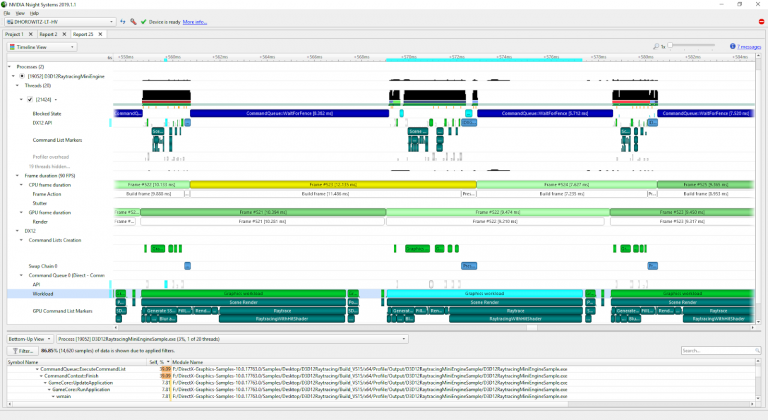
As PyData leverages much of the static language world for speed including CUDA, we need tools which not only profile and measure across languages but also devices, CPU, and GPU. While there are many great profiling tools within the Python ecosystem: line-profilers like cProfile and profilers which can observe code execution in C-extensions like PySpy/Viztracer. None of the Python profilers can��
]]>