
As of 3/18/25, NVIDIA Triton Inference Server is now NVIDIA Dynamo.
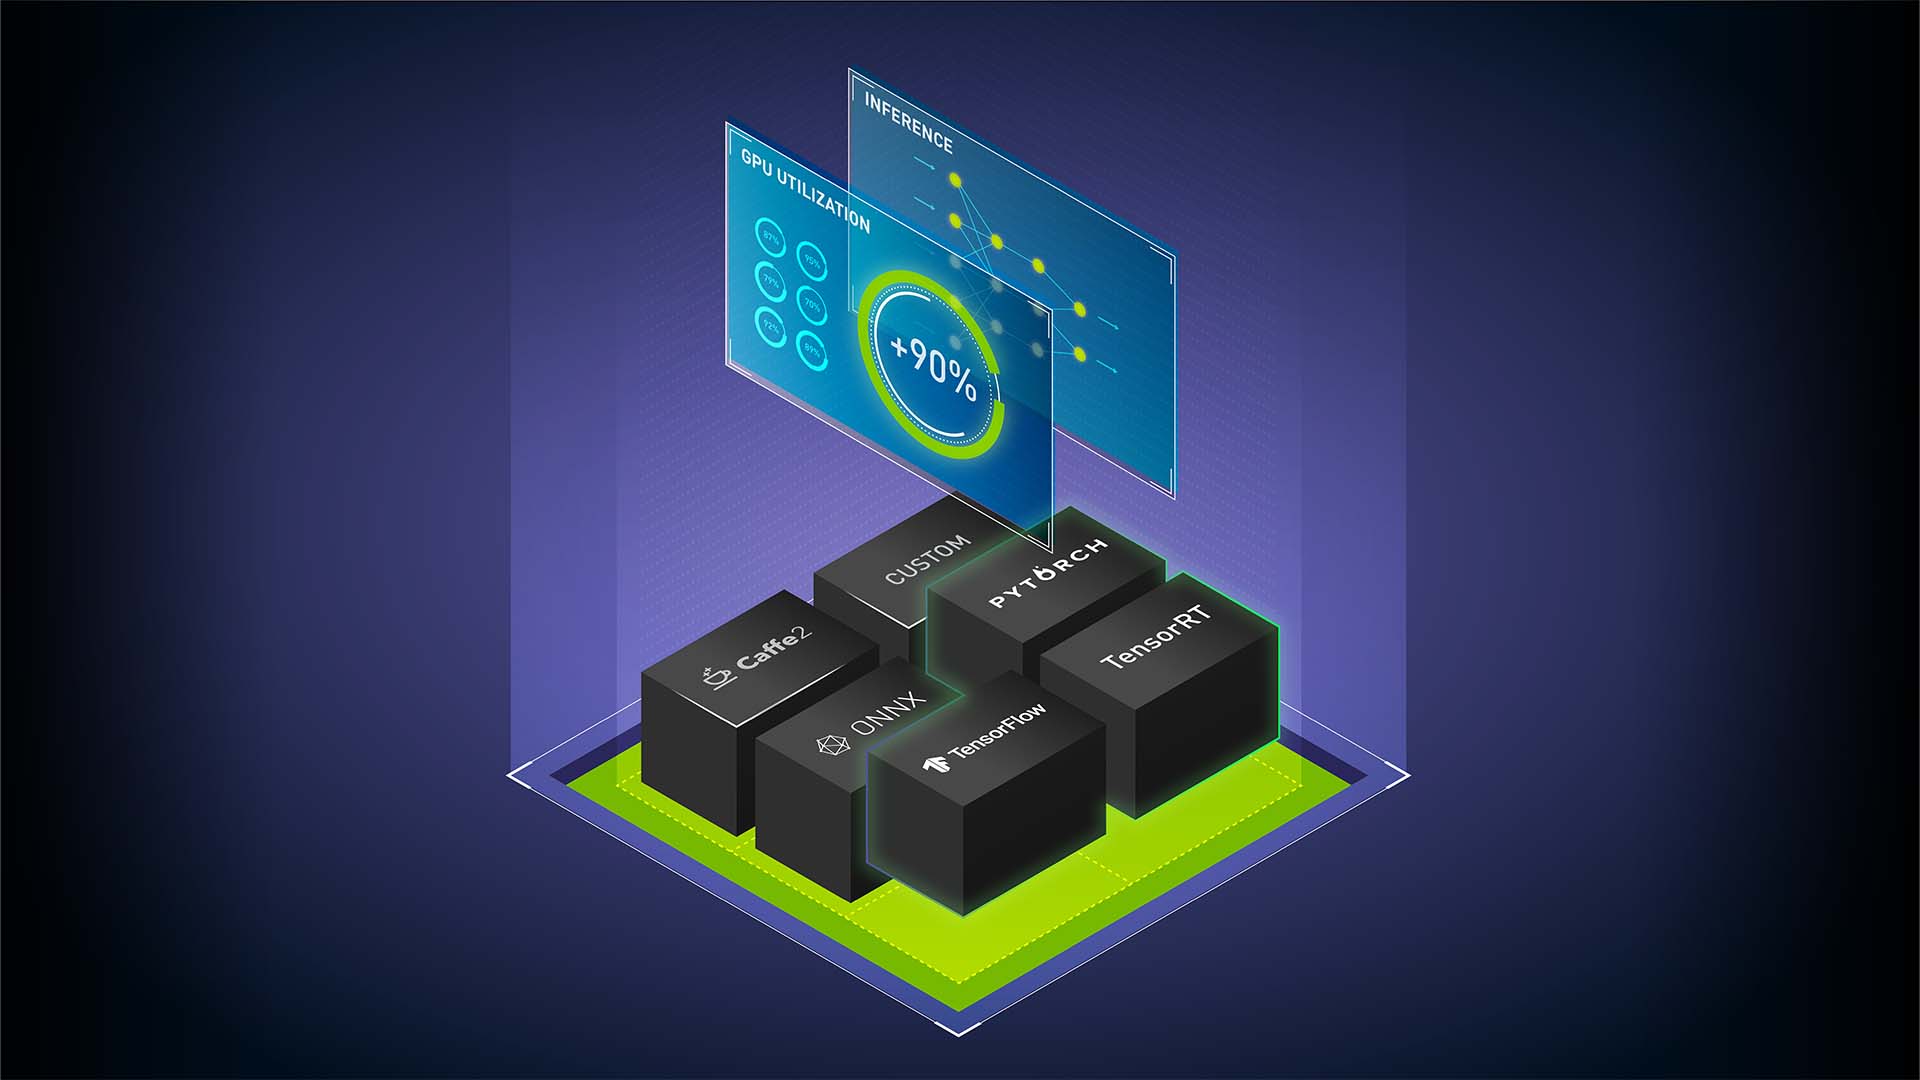
NVIDIA Triton Inference Server is an open-source AI model serving software that simplifies the deployment of trained AI models at scale in production. Clients can send inference requests remotely to the provided HTTP or gRPC endpoints for any model managed by the server.
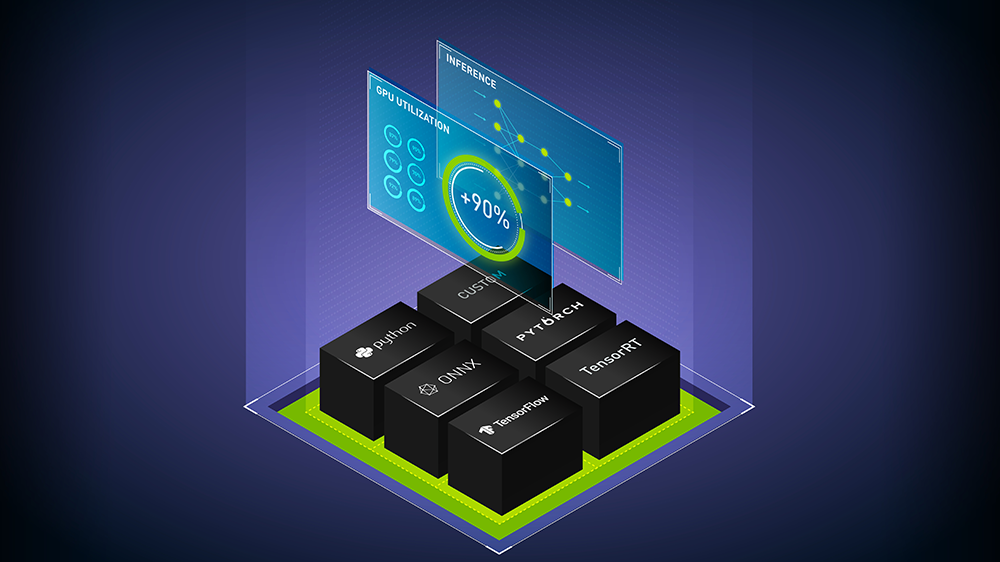
NVIDIA Triton can manage any number and mix of models (limited by system disk and memory resources). It also supports multiple deep-learning frameworks such as TensorFlow, PyTorch, NVIDIA TensorRT, and so on. This provides flexibility to developers and data scientists, who no longer have to use a specific model framework. NVIDIA Triton is designed to integrate easily with Kubernetes for large-scale deployment in the data center.
Multi-Instance GPU (MIG) can maximize the GPU utilization of A100 GPU and the newly announced A30 GPU. It can also enable multiple users to share a single GPU, by running multiple workloads in parallel as if there were multiple, smaller GPUs. MIG capability can divide a single GPU into multiple GPU partitions called GPU instances. Each instance has dedicated memory and compute resources, so the hardware-level isolation ensures simultaneous workload execution with guaranteed quality of service and fault isolation.
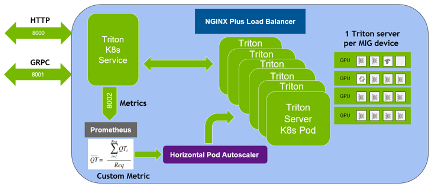
In this post, we share the following best practices:
- Deploying multiple Triton Inference Servers in parallel using MIG on A100
- Autoscaling the number of Triton Inference Servers based on the number of inference requests using Kubernetes and Prometheus monitoring stack.
- Using the NGINX Plus load balancer to distribute the inference load evenly among different Triton Inference Servers.
This idea can be applied to multiple A100 or A30 GPUs on a single node or multiple nodes for autoscaling NVIDIA Triton deployment in production. For example, a DGX A100 allows up to 56 Triton Inference Servers (each A100 having up to seven servers using MIG) running on Kubernetes Pods.
Hardware and software prerequisites
To use MIG, you must enable MIG mode and create MIG devices on A100 or A30 GPUs. You can use nvidia-smi to create GPU instances and compute instances manually. Alternately, use the NVIDIA new MIG Parted tool nvidia-mig-parted, which allows administrators to define declaratively a set of possible MIG configurations to be applied to all GPUs on a node.
At runtime, point nvidia-mig-parted at one of these configurations, and nvidia-mig-parted takes care of applying it. In this way, the same configuration file can be spread across all nodes in a cluster, and a runtime flag can be used to decide which of these configurations to be applied to a node. Because the MIG configuration is gone if you reboot the machine, nvidia-mig-parted also makes it easier to create MIG instances after rebooting.
In the Kubernetes environment, you must install the NVIDIA device plug-in and GPU feature discovery plug-in to be able to use MIG. You could install each plug-in separately, or use the cloud-native NVIDIA GPU Operator, which is a single package that includes everything to enable GPU in Kubernetes. You can also use the NVIDIA deployment tool DeepOps, which takes care of installation and plug-ins, and the Prometheus monitoring stack including kube-prometheus, Prometheus, and the Prometheus adapter, that you should use for autoscaling Triton Inference Servers.
You could use either single strategy or mixed strategy for MIG in Kubernetes. In this post, we suggest the mixed strategy, as you have seven MIG devices for one A100 GPU while the other A100 MIG is disabled.
Use the Flower demo, which classifies the images of flowers using ResNet50. The NVIDIA Triton Inference Server container image can be pulled from NGC. Prepare the server’s model files (*.plan, config.pbtxt) and client for the Flower demo. For more information, see Minimizing Deep Learning Inference Latency with NVIDIA Multi-Instance GPU.
Flower demo with Kubernetes
After setting up the flower demo, you want to extend it to a Deployment in a Kubernetes environment. Do this so that the number of Triton Inference Servers can be autoscaled based on the inference requests and the inference load can be distributed among all the servers. Because it allows up to seven MIG devices on an A100, you can have up to seven Kubernetes Pods, each having a Triton Inference Server running on a MIG device. Here are the major steps to deploying Triton Inference Servers with autoscaling and load balancing:
- Create a Kubernetes Deployment for Triton Inference Servers.
- Create a Kubernetes Service to expose Triton Inference Servers as a network service.
- Expose NVIDIA Triton metrics to Prometheus using kube-prometheus and PodMonitor.
- Create ConfigMap to define a custom metric.
- Deploy Prometheus Adapter and expose the custom metric as a registered Kubernetes APIService.
- Create HPA (Horizontal Pod Autoscaler) to use the custom metric.
- Use NGINX Plus load balancer to distribute inference requests among all the Triton Inference servers.
The following sections provide the step-by-step guide to achieve these goals.
Create a Kubernetes Deployment for Triton Inference Servers
The first step is to create a Kubernetes Deployment for Triton Inference Servers. A Deployment provides declarative updates for Pods and ReplicaSets. A ReplicaSet in Kubernetes starts multiple instances of the same Pod at the same time.
The following flower-replicas3.yml file creates three replicated Pods, indicated by the .spec.replicas field, which can be any number between one to seven. The .spec.selector field defines how the Deployment finds which Pods to manage. Each Pod runs one container, named flower, which runs the Triton Inference Server image at version 20.12-py3. Same as NVIDIA Triton port numbers, the container ports 8000, 8001, 8002 are reserved for HTTP, gRPC, and NVIDIA Triton metrics, respectively.
The .resources.limits field specifies a MIG device with 5 GB of memory for each Pod using the mixed strategy. The notation nvidia.com/mig-1g.5gb is specific to the mixed strategy and must be adapted accordingly for your Kubernetes cluster. In this example, the model for NVIDIA Triton is stored on a shared file system using NFS protocol. If you do not have a shared file system, you must ensure that the model is loaded to all worker nodes to be accessible by the Pods started by Kubernetes.
apiVersion: apps/v1
 kind: Deployment
 metadata:
   name: flower
   labels:
     app: flower
 spec:
   replicas: 3
   selector:
     matchLabels:
       app: flower
   template:
     metadata:
       labels:
         app: flower
     spec:
       volumes:
       - name: models
         nfs:
           server: <IP address of the server>
           path: <path/to/flowerdemo/model/files>
           readOnly: false
       containers:
         - name: flower
           ports:
           - containerPort: 8000
             name: http-triton
           - containerPort: 8001
             name: grpc-triton
           - containerPort: 8002
             name: metrics-triton
           image: "nvcr.io/nvidia/tritonserver:20.12-py3"
           volumeMounts:
           - mountPath: /models
             name: models
           command: ["/bin/sh", "-c"]
           args: ["cd /models /opt/tritonserver/bin/tritonserver --model-repository=/models --allow-gpu-metrics=false --strict-model-config=false"]
           resources:
             limits:
               nvidia.com/mig-1g.5gb: 1
Create a Kubernetes Deployment using the command kubectl apply:
 $ kubectl apply -f flower-replicas3.yml
 deployment.apps/flower created
Confirm that three Pods were created:
 $ kubectl get pods
 NAME                               READY  STATUS  RESTARTS   AGE
 flower-5cf8b78894-2qqz8   1/1     Running            0          5s
 flower-5cf8b78894-g679c   1/1     Running            0          5s
 flower-5cf8b78894-xswwj   1/1     Running            0          5s
Because you have a ReplicaSet deployed in this step, you can manually scale the Pod number up or down using the command kubectl scale:
$ kubectl scale deployment flower --replicas=7
 deployment.apps/flower scaled
 $ kubectl get pods
 NAME                              READY   STATUS     RESTARTS   AGE
 flower-5cf8b78894-2qqz8   1/1     Running             0          69s
 flower-5cf8b78894-5znzt   1/1       Running            0          5s
 flower-5cf8b78894-g679c   1/1     Running            0          69s
 flower-5cf8b78894-gwgm6   1/1     Running            0          5s
 flower-5cf8b78894-shm2s   1/1     Running            0          5s
 flower-5cf8b78894-wrn9p   1/1     Running            0          5s
 flower-5cf8b78894-xswwj   1/1     Running            0          69s
Create a Kubernetes Service for Triton Inference Servers
The second step is to create a Kubernetes Service to expose Triton Inference Servers as a network service, so that clients can send inference requests to the servers. When creating a Service, choose the option of automatically creating an external load balancer, as shown in the .type field. This provides an externally accessible IP address that sends traffic to the correct port on the node. The following code example is the flower-service.yml file:
apiVersion: v1
 kind: Service
 metadata:
   name: flower
   labels:
     app: flower
 spec:
   selector:
     app: flower
   ports:
     - protocol: TCP
       port: 8000
       name: http
       targetPort: 8000
     - protocol: TCP
       port: 8001
       name: grpc
       targetPort: 8001
     - protocol: TCP
       port: 8002
       name: metrics
       targetPort: 8002
   type: LoadBalancer
Similarly, create the Kubernetes Service using the following command:
$ kubectl apply -f flower-service.yml
 service/flower created
Confirm that the Service is created:
$ kubectl get svc
 NAME    TYPE               CLUSTER-IP EXTERNAL-IP   PORT(S)       AGE
 flower   LoadBalancer   10.233.24.169   <pending>     8000:31268/TCP,8001:32231/TCP,8002:30499/TCP                            69s
The other way to create a Service is using the command kubectl expose. The Service file can be edited by the kubectl edit svc metrics command:
$ kubectl expose deployment flower --type=LoadBalancer --name=metrics
 service/metrics exposed
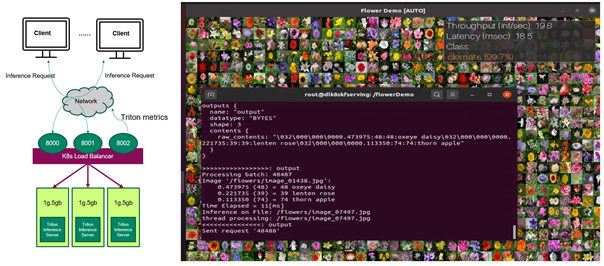
Now the Triton Inference Servers are ready to receive inference requests from the remote clients (Figure 1). If the client sends inference requests, the client can view the classification results of the flower images and also the throughput and end to end latency of each inference request.
So far, you have multiple Triton Inference Servers running on MIG devices in Kubernetes environments, doing inference on the flower images sent by the client and you can manually change the number of servers. In the next sections, you improve it so that the number of servers can be autoscaled based on the client requests.
Use Prometheus to scrape NVIDIA Triton metrics
To automatically change the number of Triton Inference servers running on Kubernetes Pods, first collect NVIDIA Triton metrics that can be used to define a custom metric. Because there are several sets of NVIDIA Triton metrics from multiple Kubernetes Pods, you should deploy a PodMonitor that tells Prometheus to scrape the metrics from all the Pods.
Prometheus is an open-source, systems monitoring and alerting toolkit that provides time series data identified by metric name and key/value pairs. PromQL, a flexible query language, is used to query metrics from Prometheus.
Create PodMonitor for Prometheus
PodMonitor defines monitoring for a set of Pods, for target discovery by Prometheus. In the flower-pod-monitor.yml file, you define a PodMonitor to monitor the Pods of the servers, as shown in the .spec.selector field. You also need kube-prometheus, which includes the deployment of Prometheus and scrapes the target configuration linking Prometheus to various metrics endpoints, as indicated by the .spec.podMetricsEndpoints field. Prometheus scrapes NVIDIA Triton metrics from these endpoints every 10 seconds, which are defined by the .interval field.
 apiVersion: monitoring.coreos.com/v1
 kind: PodMonitor
 metadata:
   name: kube-prometheus-stack-tritonmetrics
   namespace: monitoring
   labels:
       release: kube-prometheus-stack
 spec:
    selector:
       matchLabels:
          app: flower
    namespaceSelector:
       matchNames:
          - default
    podMetricsEndpoints:
    - port: metrics-triton
       interval: 10s
       path: /metrics
A common problem related to PodMonitor identification by Prometheus is related to incorrect tagging that does not match the Prometheus custom resource definition scope. To match the labels of the NVIDIA Triton Deployment, make sure that the .spec.selector.matchLabels field is app:flower, and the .spec.namespaceSelector.matchNames field is -default. Both should be under the same namespace as the NVIDIA Triton Deployment. This can be confirmed by checking the related labels in the flower-replicas3.yml file. To match the labels of kube-prometheus, also make sure that the .metadata.labels field is release: kube-prometheus-stack. Check the labels using the following commands:
$ kubectl get Prometheus -n monitoring
    NAME                                                 VERSION   REPLICAS   AGE
    kube-prometheus-stack-prometheus   v2.21.0               1          56d
    $ kubectl describe Prometheus kube-prometheus-stack-prometheus -n monitoring
    Name:         kube-prometheus-stack-prometheus
    Namespace:    monitoring
    Labels:       app=kube-prometheus-stack-prometheus
               chart=kube-prometheus-stack-10.0.2
               heritage=Helm
               release=kube-prometheus-stack
    Annotations:  <none>
    API Version:  monitoring.coreos.com/v1
    Kind:         Prometheus
    Metadata:
    ……

       Pod Monitor Namespace Selector:
       Pod Monitor Selector:
          Match Labels:
             Release:   kube-prometheus-stack
Deploy the PodMonitor using the command kubectl apply -f flower-pod-monitor.yml and confirm it:
$ kubectl get PodMonitor -n monitoring
     NAME                                                  AGE
     kube-prometheus-stack-tritonmetrics   20s
Query NVIDIA Triton metrics using Prometheus
By default, Prometheus comes with a user interface that can be accessed on port 9090 on the Prometheus server. Open Prometheus in a web browser and choose Status, Targets. You can see that the metrics from three servers are correctly detected by kube-prometheus and added to Prometheus for scrapping.
You can query any NVIDIA Triton metrics such as nv_inference_queue_duration_us or nv_inference_request_success individually or query the following custom metric using PromQL and get the three values calculated by Prometheus (Figure 2). Add avg to get the average value of the three Pods:
avg(delta(nv_inference_queue_duration_us[30s])/(1+delta(nv_inference_request_success[30s]))).
When you choose Graph, Prometheus also provides time series data as a graph. We provide more information on this metric in the next section.
![Prometheus can calculate the three values of the customer metric from three Pods.]](https://developer-blogs.nvidia.com/wp-content/uploads/2021/06/promql-query.png)
Figure 2. Query the custom metric using PromQL in Prometheus graphical user interface
Autoscale Triton Inference Servers
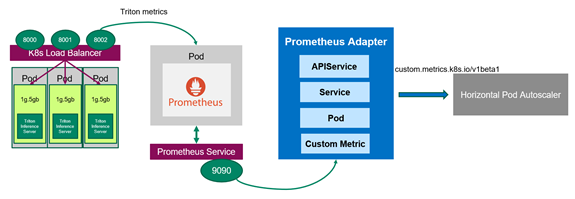
Now that you have Prometheus monitoring the servers, you should deploy the Prometheus adapter, which knows how to communicate with both Kubernetes and Prometheus (Figure 3). The adapter helps you use the metrics collected by Prometheus to make scaling decisions. The adapter gathers the names of available metrics from Prometheus at a regular interval and then only exposes metrics that follow specific forms. These metrics are exposed by an API service and can be readily used by HPA.
Optional: Enable permissive binding
In the Kubernetes cluster, role-based access control (RBAC) is a common method to regulate access to different objects. For this example, you must allow the HPA running in a different namespace to access the metrics provided by the metrics API. The configuration for RBAC differs greatly with respect to the configuration of your Kubernetes cluster. For more information about how to use role-based access control, see Using RBAC Authorization.
In the demo, you can create a ClusterRoleBinding object with permissive binding to allow the kubelet user access to all Pods by issuing the following command. This effectively disables any kind of security within your Kubernetes cluster and must not be used for a production environment.
$kubectl create clusterrolebinding permissive-binding --clusterrole=cluster-admin --user=admin --user=kubelet --group=system:serviceaccounts
Create ConfigMap to define the custom metric
First, tell the Prometheus adapter how to collect a specific metric. You use two NVIDIA Triton metrics to define the custom metric avg_time_queue_us in a ConfigMap for which HPA performs autoscaling. A ConfigMap has a key and the value looks like a fragment of a configuration format. In the ConfigMap file custom-metrics-server-config.yml, the following values are used:
nv_inference_request_success[30]is the number of successful inference requests in the past 30 seconds.nv_inference_queue_duration_usis the cumulative inference queuing duration in microseconds.
The custom metric means the average queue time per inference request in the past 30 seconds and HPA decides whether to change the replica number based on it.
When configuring the Prometheus adapter, it is important that the metrics have a named endpoint such as a Pod to be addressed to. Unaddressed metrics cannot be queried from the metrics API later. Add the .overrides field to enforce that pod and namespace are exposed in the API later.
apiVersion: v1
 kind: ConfigMap
 metadata:
   name: adapter-config
   namespace: monitoring
 data:
   triton-adapter-config.yml: |
     rules:
     - seriesQuery: 'nv_inference_queue_duration_us{namespace="default",pod!=""}'
       resources:
         overrides:
           namespace:
             resource: "namespace"
           pod:
             resource: "pod"
       name:
         matches: "nv_inference_queue_duration_us"
         as: "avg_time_queue_us"
      metricsQuery: 'avg(delta(nv_inference_queue_duration_us{<<.LabelMatchers>>}[30s])/
 (1+delta(nv_inference_request_success{<<.LabelMatchers>>}[30s]))) by (<<.GroupBy>>)'

      Create the ConfigMap and confirm it:
 $ kubectl apply -f custom-metrics-server-config.yml
 configmap/adapter-config created
 $ kubectl get configmap -n monitoring
 NAME                                                      DATA   AGE
 adapter-config                                            1        22s
Create the Prometheus adapter for the Kubernetes metrics API
For the HPA to react to this custom metric, you must create the Kubernetes Deployment, Service, and APIService for the Prometheus adapter. The following code example is the Deployment file, custom-metrics-server-deployment.yml. It uses the ConfigMap from the last step, which tells the adapter to collect the custom metric. It also creates the Deployment that spawns the adapter Pod to pull the custom metric from Prometheus. The .containers.config field must match the .mountPath field and the filename triton-adapter-configl.yml created in the ConfigMap in the previous step.
 apiVersion: apps/v1
 kind: Deployment
 metadata:
   name: triton-custom-metrics-apiserver
   namespace: monitoring
   labels:
     app: triton-custom-metris-apiserver
 spec:
   replicas: 1
   selector:
     matchLabels:
       app: triton-custom-metrics-apiserver
   template:
     metadata:
       labels:
         app: triton-custom-metrics-apiserver
     spec:
       containers:
       - name: custom-metrics-server
         image: quay.io/coreos/k8s-prometheus-adapter-amd64:v0.4.1
         args:
         - --cert-dir=/tmp
         - --prometheus-url=<IP address:9090>
         - --metrics-relist-interval=30s
         - --v=10
         - --config=/etc/config/triton-adapter-config.yml
         - --secure-port=6443
         ports:
         - name: main-port
           containerPort: 6443
         volumeMounts:
         - name: config-volume
           mountPath: /etc/config
           readOnly: false
       volumes:
       - name: config-volume
         configMap:
           name: adapter-config
Create a Kubernetes Service for the Prometheus adapter. In the following file, custom-metrics-server-service.yml, the .spec.selector. field must match the labels app: triton-custom-metris-apiserver in the Deployment, to specify the Pod that provides the Service.
apiVersion: v1
 kind: Service
 metadata:
   name: triton-custom-metrics-api
   namespace: monitoring
 spec:
   selector:
     app: triton-custom-metrics-apiserver
   ports:
   - port: 443
     targetPort: 6443
Next, create an APIService so that the Prometheus adapter is accessible by Kubernetes. Then, the custom metric can be fetched by HPA. The following code block is the APIService file custom-metrics-server-apiservice.yml. The .spec.service field must match the .metadata field of the Service file. To allow the autoscaler to access the custom metric, you should register the metric with the API aggregator. The required API to use here is custom.metrics.k8s.io/v1beta1.
 apiVersion: apiregistration.k8s.io/v1beta1
 kind: APIService
 metadata:
   name: v1beta1.custom.metrics.k8s.io
 spec:
   insecureSkipTLSVerify: true
   group: custom.metrics.k8s.io
   groupPriorityMinimum: 100
   versionPriority: 5
   service:
     name: triton-custom-metrics-api
     namespace: monitoring
   version: v1beta1
Before you deploy the Prometheus adapter, you can see that no metrics are available at the API point:
 $ kubectl get --raw "/apis/custom.metrics.k8s.io/v1beta1" | jq
 Error from server (NotFound): the server could not find the requested resource
Use the command kubectl apply to apply the configuration in the three .yml files previously mentioned. After you create the APIService for the Prometheus adapter, you can see that the custom metric is available:
 $ kubectl get --raw /apis/custom.metrics.k8s.io/v1beta1 | jq .
 {
   "kind": "APIResourceList",
   "apiVersion": "v1",
   "groupVersion": "custom.metrics.k8s.io/v1beta1",
   "resources": [
     {
       "name": "namespaces/avg_time_queue_us",
       "singularName": "",
       "namespaced": false,
       "kind": "MetricValueList",
      "verbs": [
      "get"
      ]
      },
      {
       "name": "pods/avg_time_queue_us",
       "singularName": "",
       "namespaced": true,
       "kind": "MetricValueList",
      "verbs": [
      "get"
      ]
      }
   ]
 }
You can also check the current value of this custom metric, which is 0 as there is currently no inference request from the client. Here, you are selecting all Pods from the default namespace, in which the flower-demo is deployed:
$ kubectl get --raw /apis/custom.metrics.k8s.io/v1beta1/namespaces/default/pods/*/avg_time_queue_us | jq .
 {
   "kind": "MetricValueList",
   "apiVersion": "custom.metrics.k8s.io/v1beta1",
   "metadata": {
     "selfLink": "/apis/custom.metrics.k8s.io/v1beta1/namespaces/default/pods/%2A/avg_time_queue_us"
   },
   "items": [
      {
       "describedObject": {
      "kind": "Pod",
      "namespace": "default",
      "name": "flower-5cf8b78894-jng2g",
         "apiVersion": "/v1"
      },
       "metricName": "avg_time_queue_us",
      "timestamp": "2021-03-25T15:49:10Z",
      "value": "0"
      }
   ]
 }
Deploy HPA
The HPA autoscales the number of Pods in a replication controller, Deployment, ReplicaSet, or stateful set based on observed metrics. Now you can create an HPA that uses the custom metric. The HPA controls the number of replicas deployed in Kubernetes according to the following equation. It operates on the ratio between desired metric value and current metric value and returns the number of desired replicas:
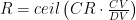
In this formula, the following are used:
 is the number of replicas that Kubernetes has.
- is the current number of replicas.
- is the current metric: the average of the custom metric values from all servers in this case.
- is the desired metric value.


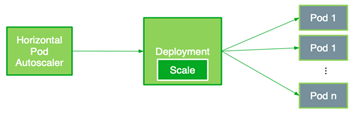
When  is different from CR, HPA increases or decreases the number of replicas by acting on the Kubernetes Deployment (Pods). Basically, whenever the ratio between the current metric value and the desired metric value is larger than 1, then new replicas can be deployed.
The following HPA file flower-hpa.yml autoscales the Deployment of Triton Inference Servers. It uses a Pods metric indicated by the .sepc.metrics field, which takes the average of the given metric across all the Pods controlled by the autoscaling target. The .spec.metrics.targetAverageValue field is specified by considering the value ranges of the custom metric from all the Pods. The field triggers HPA to adjust the number of replicas periodically to match the observed custom metric with the target value.
  apiVersion: autoscaling/v2beta1
 kind: HorizontalPodAutoscaler
 metadata:
     name: flower-hpa
 spec:
     scaleTargetRef:
       apiVersion: apps/v1beta1
       kind: Deployment
       name: flower
     minReplicas: 1
     maxReplicas: 7
     metrics:
     - type: Pods
       pods:
         metricName: avg_time_queue_ms
         targetAverageValue: 50
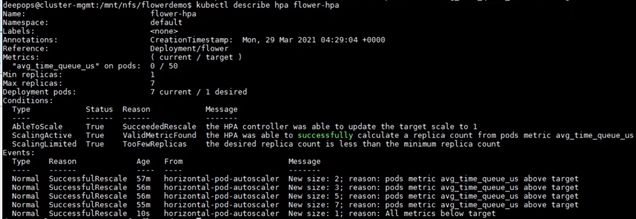
Create the HPA using the command kubectl apply -f flower-hpa.yml and confirm it:
 $ kubectl get hpa
 NAME         REFERENCE      TARGETS   MINPODS   MAXPODS   REPLICAS   AGE
 flower-hpa   Deployment/flower   0/50              1                 7                    1              22s
If clients start sending inference requests to the servers, the new HPA can pick up the custom metric for the Deployment and establish the needed number of Pods. For example, when there are increasing inference requests, HPA increases the number of Pods from 1 to 2, and gradually to 7, which is the maximum number of Pods on an A100 GPU. Finally, when the clients stop sending inference requests, HPA decreases the Replica number to only 1 (Figure 5).
Load balance with NGINX Plus
Load balancing is for distributing the load from clients optimally across available servers. Earlier, you chose the Kubernetes built-in load balancer, a Layer 4 (transport layer) load balancer, which is easy to deploy but with the limitation using gRPC.
In this demo, using Prometheus, you find that the Pods newly added by the autoscaler cannot get the workload using Kubernetes built-in load balancer. To improve this, use NGINX Plus, which is a Layer 7 (application layer) load balancer. The workload is evenly distributed among all the Pods, including the newly scaled-up Pods.
First, you should create an NGINX Plus image because a commercial offering of NGINX Plus is not available from Docker Hub. Create an NGINX instance in a Docker container using the NGINX open source image from Docker Hub. Then, push the local image to a private Docker registry.
Next, to deploy NGINX Plus, label the node on which to deploy NGINX Plus with role=nginxplus using the following command:
$ kubectl label node <IP address or node name> role=nginxplus
Modify the Service to set clusterIP to none, so that all the replicas endpoints are exposed and identified by NGINX Plus. To avoid confusion, create a new Service file, flower-service-nginx.yml, and apply it:
 apiVersion: v1
 kind: Service
 metadata:
   name: flower-nginx
   labels:
     app: flower
 Spec:
   clusterIP: None
   selector:
     app: flower
   ports:
     - protocol: TCP
       port: 8000
       name: http
       targetPort: 8000
     - protocol: TCP
       port: 8001
       name: grpc
       targetPort: 8001
Next, create a configuration file for NGINX. The following code example assumes that you are using the location /path/to/nginx/config/nginx.conf.
 resolver <K8s DNS server IP> valid=5s;
 upstream backend {
    zone upstream-backend 64k;
    server <clusterIP FQDN: 8000> resolve;
 }

 upstream backendgrpc {
    zone upstream-backend 64k;
    server <clusterIP FQDN:8001> resolve;
 }

 server {
    listen 80;
    status_zone backend-servers;

    location / {
      proxy_pass http://backend;
      health_check uri=/v2/health/ready;
    }
 }

 server {
         listen 89 http2;

         location / {
             grpc_pass grpc://backendgrpc;
         }
 }

 server {
     listen 8080;
     root /usr/share/nginx/html;
     location = /dashboard.html { }
     location = / {
        return 302 /dashboard.html;
     }
     location /api {
       api write=on;
     }
 }
Lastly, you should create a ReplicationController for NGINX Plus in the following nginxplus-rc.yml file. To pull the image from the private registry, Kubernetes needs credentials. The imagePullSecrets field in the configuration file specifies that Kubernetes should get the credentials from a Secret named regcred. In this configuration file, you must also mount the NGINX config file created in the last step to the location /etc/nginx/conf.d.
  apiVersion: v1
 kind: ReplicationController
 metadata:
   name: nginxplus-rc
 spec:
   replicas: 1
   selector:
     app: nginxplus
   template:
     metadata:
       labels:
         app: nginxplus
     spec:
       nodeSelector:
         role: nginxplus
       imagePullSecrets:
       - name: regcred
       containers:
       - name: nginxplus
         command: [ "/bin/bash", "-c", "--" ]
         args: [ "nginx; while true; do sleep 30; done;" ]
         imagePullPolicy: IfNotPresent
         image: nvcr.io/nvidian/swdl/nginxplus:v1
         ports:
           - name: http
             containerPort: 80
             hostPort: 8085
           - name: grpc
             containerPort: 89
             hostPort: 8087
           - name: http-alt
             containerPort: 8080
             hostPort: 8086
           - name: flower-svc
             containerPort: 8000
             hostPort: 32309
         volumeMounts:
           - mountPath: "/etc/nginx/conf.d"
             name: etc-nginx-confd
       volumes:
         - nfs:
            server: <NFS server IP>
            path: </path/to/nginx/config>
            readOnly: false
           name: etc-nginx-confd
Create the ReplicationController using the following command:
kubectl create -f nginxplus-rc.yml
Verify the Deployment. You should find that NGINX Plus is running:
 $kubectl get pods
 NAME                      READY   STATUS    RESTARTS   AGE
 flower-5cf8b78894-jng2g   1/1     Running   0          8h
 nginxplus-rc-nvj7b        1/1     Running   0          10s
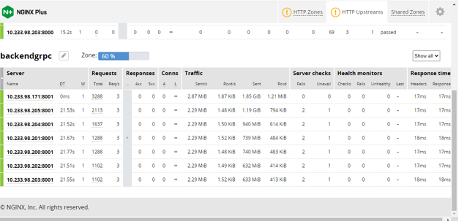
Now when clients send inference requests to the servers, you can see the NGINX Plus Dashboard (Figure 6):
- The autoscaler increases the number of Pods gradually from one to seven.
- The workload is evenly distributed among all the Pods, as shown in Traffic.
You can also confirm that the newly added Pods are busy working by checking the values of the metrics or custom metric from all the Pods in Prometheus.
Conclusion
This post showed the step-by-step instructions and code to deploy Triton Inference Servers at a large scale with MIG in a Kubernetes environment. We also showed you how to autoscale the number of servers and balance the workload using two different types of load balancers. We recorded all the steps and results and you can also watch the Triton Deployment at Scale with Multi-Instance-GPU (MIG) and Kubernetes GTC’21 session.
For more information about using MIG to run multiple deep learning workloads in parallel on a single A100 GPU, see Getting the Most Out of the NVIDIA A100 GPU with MIG.